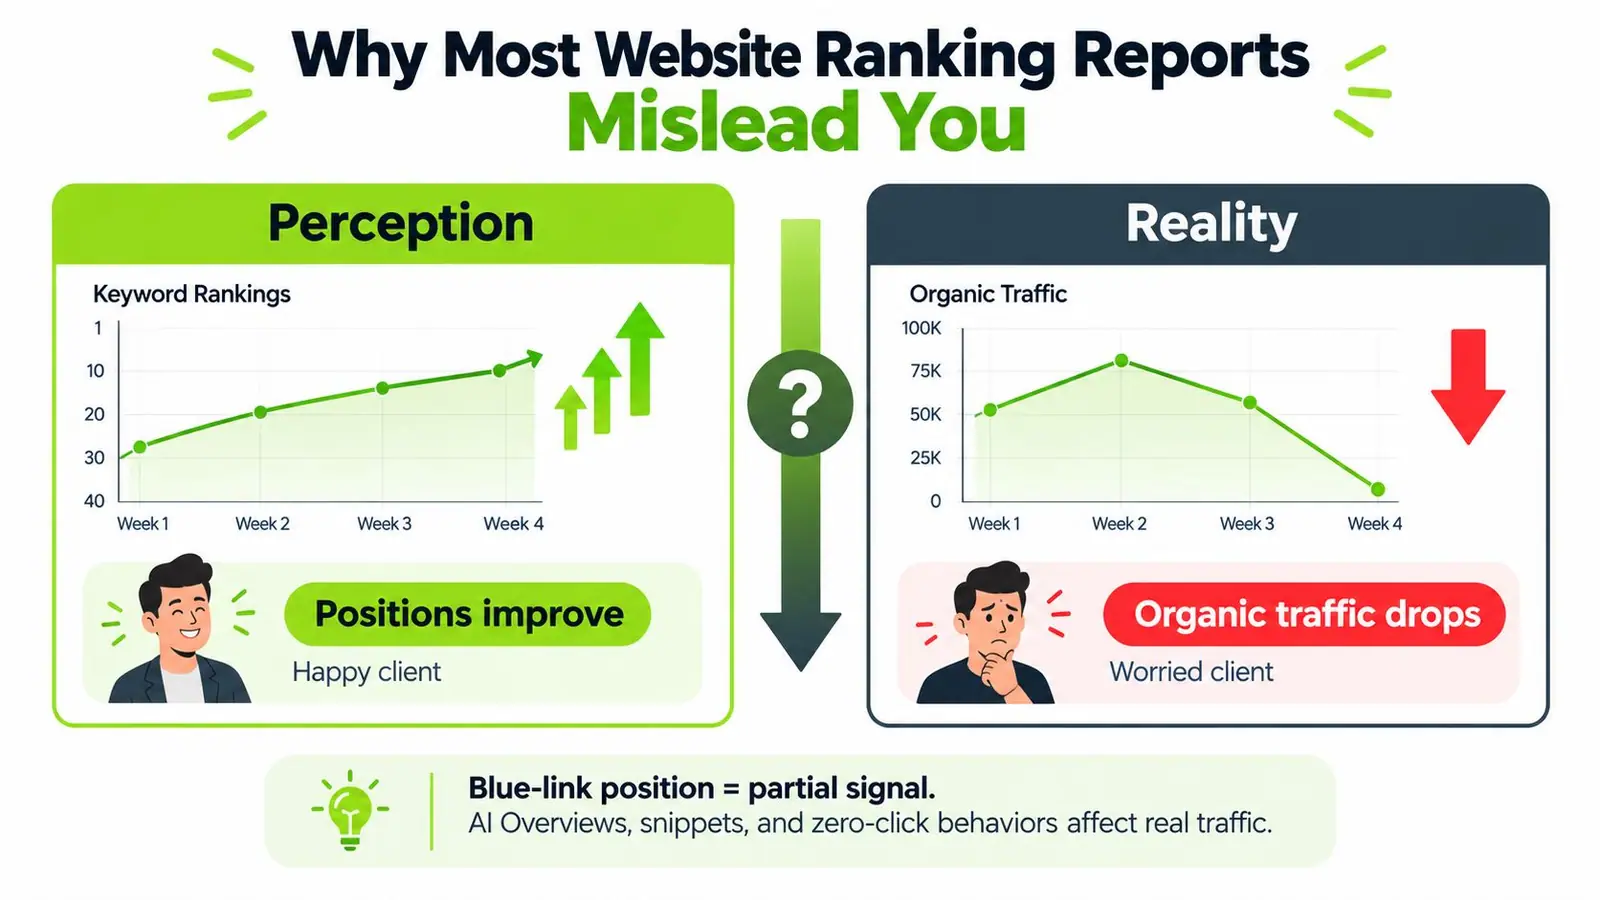
You're in the monthly performance review. The deck shows rankings moving up, the client approves the progress, and then organic traffic declines before the next meeting. Everyone starts searching for an explanation, but the report was built to display position changes, not to explain business outcomes.
That's the central problem with many website ranking reports. They treat a higher blue-link position as proof of better visibility, even though clicks depend on the query, device, location, search features, intent, and the page competing for the visit. A useful report must do more than answer “What rank are we?” It must help someone decide what to change, protect, test, or fund next.
Why Most Website Ranking Reports Mislead You
Most reports fail before the first chart appears. They track a convenient keyword list, calculate an average position, and present the change as progress. A client sees green arrows, but the business may be receiving fewer qualified visits.
Average position is especially easy to misuse. A domain can improve overall while most valuable terms remain clustered between positions 8 and 20, where small movements may not create meaningful commercial impact. A jump from position 9 to position 6 can also lose practical value if the query now receives an AI Overview that answers the question before the searcher visits a blue-link result.
Three reporting choices create most of the confusion
- The wrong keyword set: A large list of low-value terms can make visibility look healthy while priority products, services, or markets lose ground.
- Visibility gets confused with demand capture: A ranking records where a result appeared. Search Console impressions, clicks, and CTR show whether people interacted with it.
- Methodology stays hidden: Device, geography, personalization, SERP features, tracking frequency, and date selection can all change the apparent trend.
The report also becomes unreliable when it ignores page mapping. If five URLs compete for the same intent, a domain-level position change hides the cannibalization problem. A stakeholder doesn't need more rows. They need to know which page owns the opportunity and whether that page earns the visit.
Practical rule: Never present a ranking gain without showing the affected query group, landing page, device, market, and click outcome.
A report can be automated without becoming useful. The SEO reporting automation workflow should support interpretation, not produce a prettier export. Before trusting any trend line, define the report's job, segment the data, explain its sources, and account for the search features that sit between a ranking and a click.
Defining the Job of Your Report Before Picking Metrics
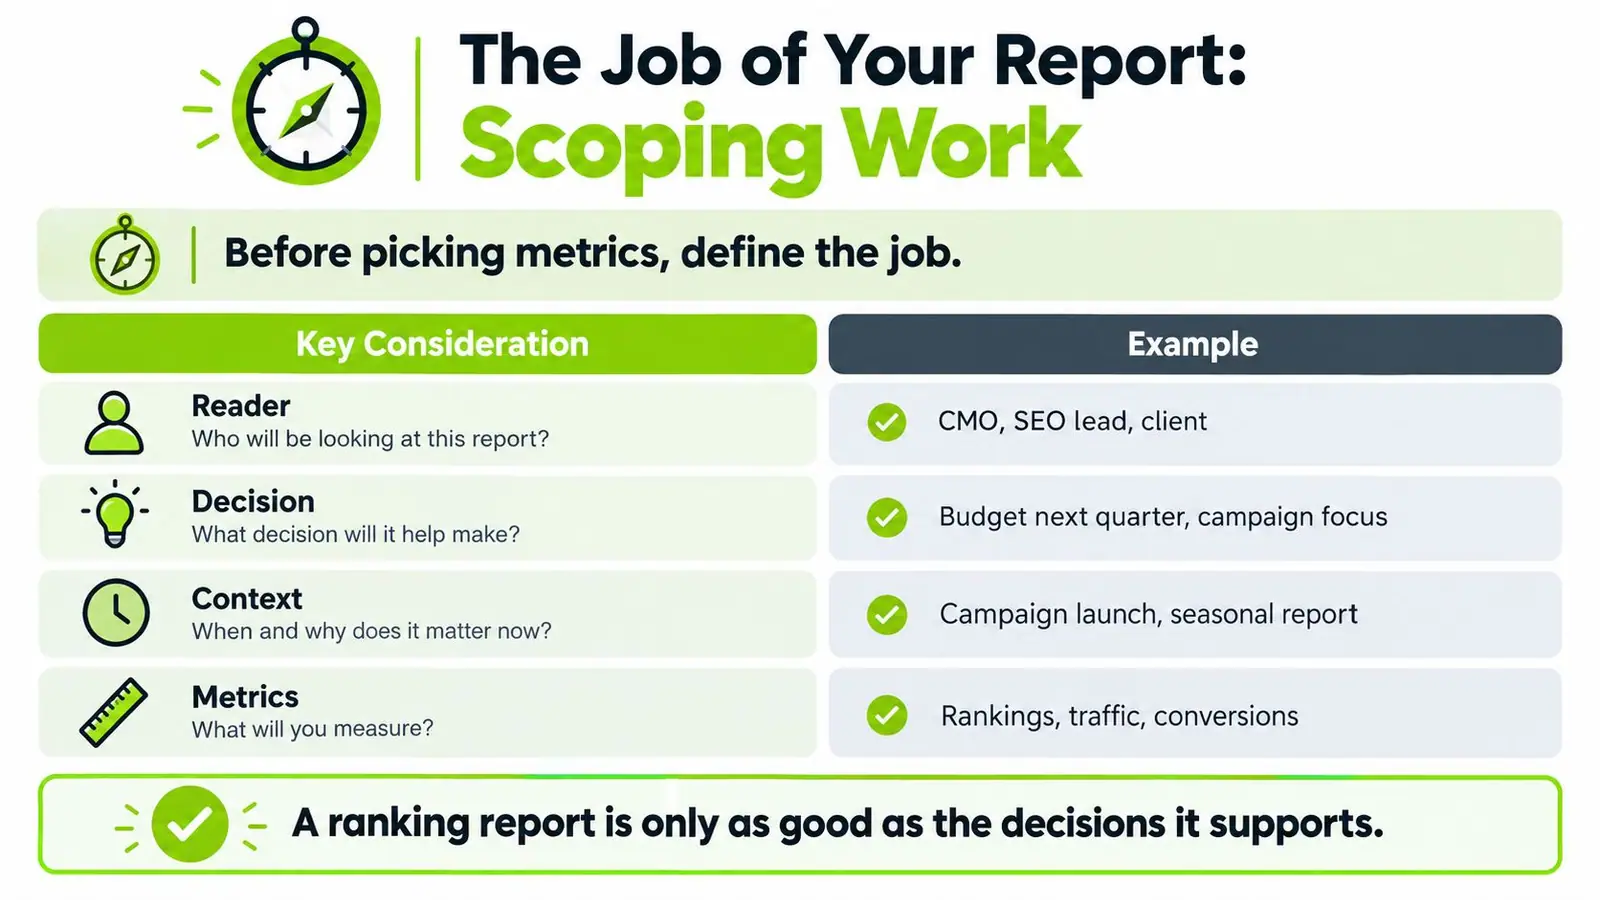
Start with the reader, not the platform. A CMO deciding next quarter's budget needs commercial outcomes and directional risk. A content lead needs page-level opportunities and intent coverage. An account manager defending retention needs a credible explanation of progress, setbacks, and the next action.
Those readers shouldn't receive the same report with different logos. The audience determines the cadence, level of detail, and amount of context. Executives usually need a concise decision summary. Specialists need query, URL, SERP, and change-level evidence.
Lock the scope before pulling data
Answer three questions:
- What is in scope? Define the pages, markets, devices, and intent buckets. Separate branded, non-branded, informational, commercial, and transactional queries where those categories matter.
- Who sets the baseline? Choose a fixed competitor set. Changing competitors every month turns a comparison into a moving target.
- What does success mean over time? Set expectations for the next 30, 60, and 90 days, without pretending every outcome will mature on the same schedule.
The report should then have three layers. The one-page executive summary states the result, business implication, risk, and recommended action. The deep-dive appendix contains keyword movement, page mapping, competitor comparisons, and SERP evidence. The methodology page records sources, filters, locations, devices, date ranges, and known limitations.
The same data can answer different questions
Suppose a keyword group gains visibility. For a CMO, that may support continued investment if qualified clicks and conversions also improve. For a content lead, the same result may reveal that several pages rank for one intent and need consolidation. For an account manager, it may show steady progress in the target market, but only after separating mobile from desktop performance.
The dataset didn't change. The decision did. That's why a clear SEO reporting dashboard structure should follow the stakeholder's next question rather than the fields available in a tracking tool.
Metrics That Belong in a Decision-Grade Report
A useful report has fewer metrics than expected. Organize them into tiers based on the decision they support, the work required to maintain them, and the damage caused when they're absent.
Tier one is the permanent operating layer
Always include share of voice against a fixed competitor set, weighted by the business value of each keyword bucket. A high-value commercial term shouldn't count the same as an incidental informational query. Pair that view with clicks, impressions, and CTR, segmented by device.
These metrics answer the basic operating questions: Are we visible against the competitors that matter? Are people choosing us? Is the result behaving differently on mobile and desktop? Without this layer, a ranking report can celebrate exposure that never becomes traffic.
Tier two adds the context behind movement
Use deeper metrics when they affect the decision:
- Page-level visibility identifies which URLs gained or lost attention.
- Query intent coverage shows whether the site is visible across the customer journey, not just for one intent type.
- SERP feature presence records featured snippets, People Also Ask inclusion, and AI Overview citations where the tracking method can verify them.
- Conversion or qualified-action data connects search performance to the outcome the business values.
These fields cost more to collect and validate, but they explain why two pages with similar rankings can produce very different results. They also help a strategist choose between updating content, fixing page targeting, improving internal links, or investigating a SERP change.
Tier three belongs in the appendix unless justified
Raw average position, total keyword count, and domain authority scores often fail under stakeholder questioning. Total keyword count can rise through low-value queries. Average position can hide distribution and intent. Authority scores may help with diagnosis, but they're not an outcome by themselves.
| Tier | Metric | Decision It Enables | Drop or Include |
|---|---|---|---|
| One | Weighted share of voice | Whether visibility is improving against the chosen competitors | Include |
| One | Clicks, impressions, and CTR by device | Whether visibility is producing engagement | Include |
| Two | Page-level visibility | Which URLs need attention | Include when relevant |
| Two | Intent coverage and SERP features | Which search experiences and customer needs remain exposed | Include when relevant |
| Three | Raw average position | Limited directional context | Drop unless explained |
| Three | Total keyword count | Whether the tracked footprint expanded | Drop unless tied to value |
| Three | Domain authority score | Possible diagnostic context | Appendix only unless decision-relevant |
Every metric must answer a question someone will be asked in the next review.
Choosing and Combining the Right Data Sources
No single source is ground truth for every question. Rank trackers measure controlled positions. Google Search Console captures the site's observed impressions and clicks. Analytics shows what visitors do after arrival. A serious report combines all three.
Match each source to its job
Rank trackers such as Ahrefs, Semrush, STAT, and AccuRanker are useful for consistent keyword monitoring across selected markets, devices, and locations. They're strongest when you need competitor comparisons, SERP feature checks, and a controlled query set.
Search Console supplies the site's actual search exposure, including impressions, clicks, CTR, and average position for the property. Analytics adds landing-page behavior and downstream actions. Those systems won't always agree, and that's normal. They use different sampling, attribution, query handling, and collection rules.
| Source | Strength | Limit | Best Use |
|---|---|---|---|
| Rank tracker | Controlled keywords, locations, devices, and competitors | Models selected searches rather than every real impression | Position trends and competitive monitoring |
| Search Console | First-party impressions, clicks, CTR, and query data | Aggregation and reporting behavior can obscure detail | Search demand and click validation |
| Analytics | On-site engagement and conversion behavior | Attribution depends on implementation and consent | Business impact after the click |
| Log files or click datasets | Additional evidence about crawling or click behavior | Requires specialist setup and interpretation | Investigating discrepancies |
Triangulate instead of forcing agreement
Use a repeatable validation pass:
- Compare tracked positions with Search Console average position for the same page and query group.
- Flag variance above 15 percent as an investigation trigger, not as proof that one source is wrong.
- Check device, location, date range, query mix, and SERP features before interpreting the difference.
- Record the explanation in the methodology notes.
Use APIs when you need scheduled, repeatable extraction into a central warehouse or dashboard. Use scraped or platform-exported data when a strategist needs a controlled spot check, provided the collection method stays consistent. If ranking and traffic diverge sharply, inspect analytics implementation, page changes, indexing, and SERP features. Log files or third-party click data can help model behavior when the available sources still leave a material gap.
Teams comparing reporting connectors may also find this Supermetrics alternative Hopted useful when evaluating how data should move into a reporting workflow. The tooling choice matters less than documenting what each source measures. A structured data process for SEO gives the strategist a defensible trail from collection to recommendation.
Account for AI Overviews and Zero-Click Behavior
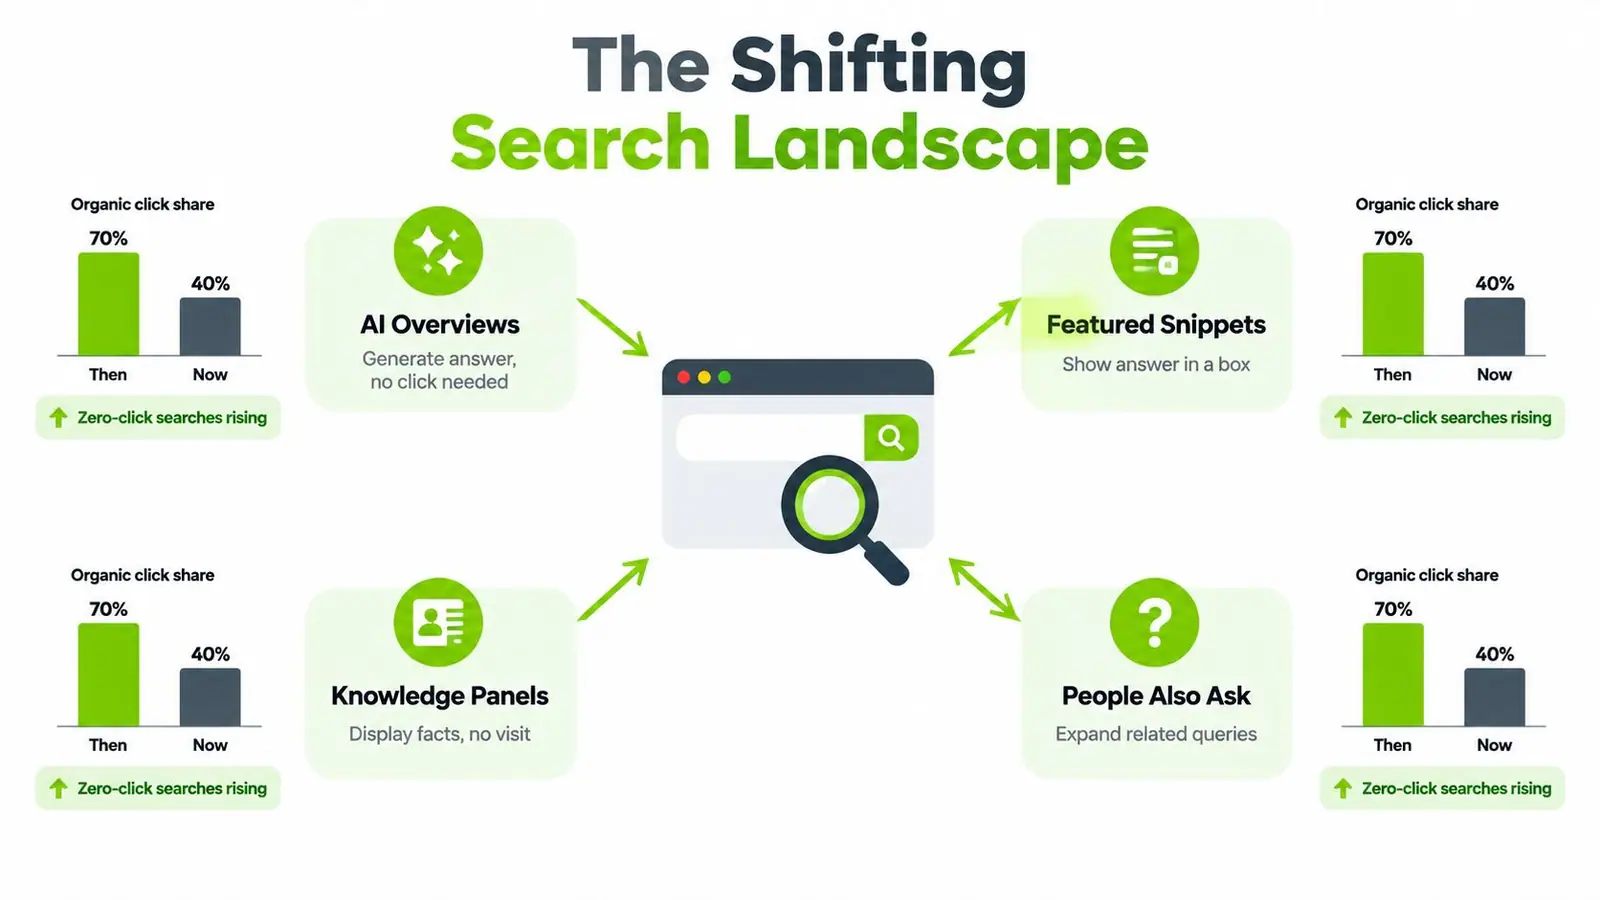
A page can retain its blue-link position while losing visits. AI Overviews, featured snippets, knowledge panels, and People Also Ask boxes may answer the query before a searcher reaches the site. Treat rankings as one visibility signal, not the report's final verdict.
The direction is clear: AI features can reduce organic clicks, while citations may create additional opportunities. Ahrefs reports a 58% drop in position-one organic CTR when an AI Overview appears, and Seer's research reports that citations can lift clicks by 35%. Pew's study of 68,000 queries found a 46.7% relative decline in clicks when AI Overviews appeared. Because these studies use different methods, do not combine the figures into a universal CTR rule. Use them to justify feature-level reporting.
Add visibility beyond the blue links
Track these fields:
- AI Overview citation share: How often the brand or target URL appears among cited sources for the tracked query set.
- SERP feature share of voice: Whether the brand appears in snippets, People Also Ask results, local features, and other visible modules.
- Brand mention frequency in AI answers: Whether relevant prompts mention the brand, product, or category association.
- Feature-adjusted CTR: CTR grouped by the SERP features present, rather than averaged across incompatible result pages.
Pair a third-party SERP feature tracker with manual sampling. Select representative queries, record visible features, inspect cited sources, and test prompts that match customer language. Prompt-level checks matter because answers can vary by wording, location, device, and context.
A ranking-only report leaves the diagnosis incomplete. The page may have improved in traditional results while the search experience changed around it. Keep the AI Overview tracking workflow beside rank tracking so stakeholders can connect visibility changes with traffic decisions.
Templates, Automation, and a Repeatable Monthly Flow
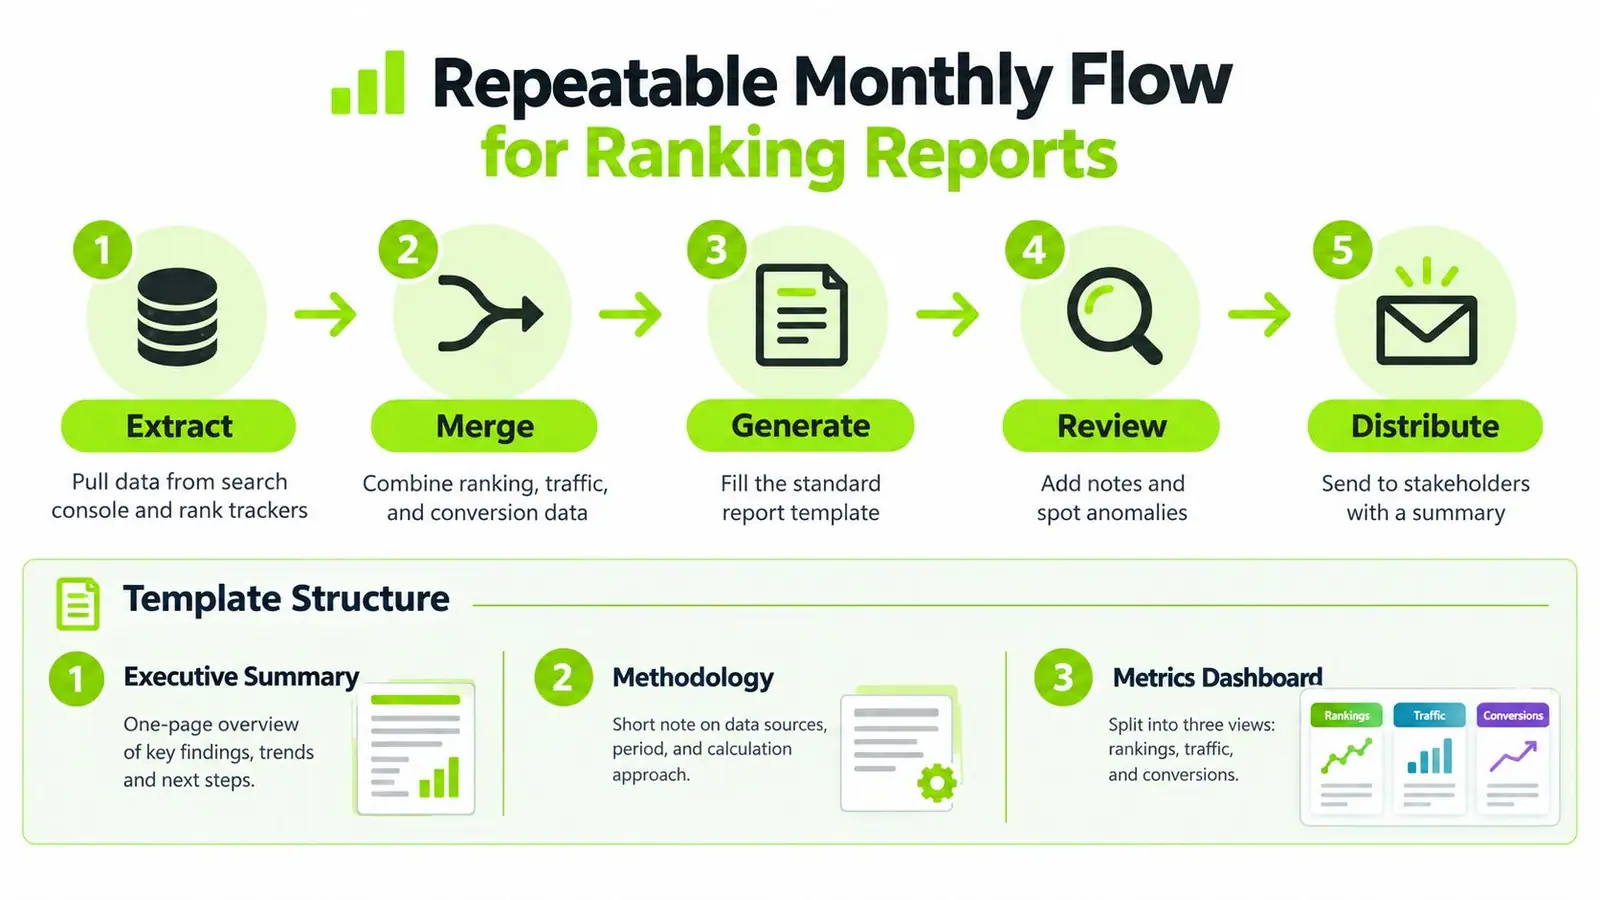
The template should make the recommendation obvious. Put the executive summary first, followed by a methodology footnote, a dashboard divided into rankings, traffic, and visibility, and an insights section that ties each finding to an action.
Build the monthly operating rhythm
Use a fixed five-day cadence:
- Day one, extract: Pull data from Search Console, analytics, and rank trackers.
- Day two, validate: Check source completeness, unusual gaps, query-set changes, and major variance.
- Day three, annotate: Mark launches, migrations, content updates, technical releases, seasonality, and competitor events.
- Day four, interpret: Draft the insight, implication, recommendation, and risk.
- Day five, deliver: Send the report with a short Loom walkthrough focused on decisions, not every chart.
Automate collection, keep judgment human
Looker Studio can present the recurring dashboard. Google Sheets APIs can support lighter workflows and controlled review. Scheduled exports from rank trackers and Search Console can populate a consistent data layer, but automation shouldn't publish unreviewed conclusions.
Keep version control on the template, source queries, transformation logic, and definitions. Add a change log that records new keyword groups, removed terms, altered competitors, tracking settings, and dashboard formula changes. Without that record, a trend can change because the methodology changed, and nobody will remember why.
The report should also include a short “what changed” note. A stakeholder should be able to distinguish a genuine performance shift from a new filter, a data refresh, a URL migration, or a revised intent classification.
Interpreting Trends and Reporting With Confidence
Interpretation is a discipline, not a feeling produced by a green chart. Start by separating a repeatable signal from daily noise. Require movement across two consecutive reporting periods before calling it a trend, compare with the same prior-year date range when seasonality matters, and flag segments with too little data to support a firm conclusion.
Keep a hypothesis log
For every meaningful shift, record the leading explanation and the evidence behind it:
- Technical change: Was there a release, redirect, indexing issue, or template alteration?
- Content change: Did the team update, consolidate, expand, or remove a page?
- SERP change: Did an AI Overview or another feature appear more often?
- Competitive change: Did another site publish, improve, or reposition a competing page?
The log prevents retrospective storytelling. It also gives the team a testing plan. If a page lost clicks while rankings held, compare its feature environment and CTR before deciding that the content failed.
Use confidence language stakeholders can act on
Write each conclusion in three parts:
- Proven: What the data directly shows.
- Suggested: The most plausible interpretation supported by several signals.
- Unconfirmed: What still requires another period, a manual check, or a controlled test.
A concise executive summary should state the recommendation, risk, and next test. For example, recommend reviewing a page group when visibility holds but qualified clicks weaken. State the risk of continued traffic loss. Then define the evidence you'll collect before changing the wider content program.
For teams formalizing this discipline, A Guide to Data Analysis and Report offers useful context for turning raw information into structured reporting. Apply the same standard to website ranking reports: consistent scope, triangulated sources, attached methodology notes, and a confidence label on every material claim.
Surnex helps agencies and in-house teams combine traditional rankings with AI visibility, competitor tracking, citations, and reporting workflows in one platform. Visit Surnex to see how you can build more trustworthy website ranking reports and explain traffic changes with clearer evidence.