
A website with an average conversion rate of 2.35% converts roughly 2 to 3 visitors out of every 100, while top-performing sites reach 5.31% or higher and the top 10% reach 11.45% or above. “Visitors on site” is an informal phrase for the people and sessions interacting with a website, and an analytics report may measure either users or sessions.
That distinction matters when a marketing lead opens a dashboard and sees traffic rising, while the product team sees no change in the number of people reached. Both teams may be correct because arrivals, identities, and interactions are different parts of the same visitor story.
A useful analysis starts by asking what the report counts. Are you measuring distinct users, visits they began, pages they opened, actions they took, or conversions they completed? Once those categories are separated, visitor data becomes far more useful for SEO, content planning, UX diagnosis, and stakeholder reporting.
What Visitors on Site Really Means
A marketing lead opens the monthly dashboard and announces, “We had 12,000 visitors on site.” The SEO manager agrees that traffic is up, but the product team points out that the number of people reached is nearly unchanged. The customer team adds that support-page views increased, while product-demo requests stayed flat.
Nobody necessarily made a mistake. The phrase visitors on site can hide at least three different measurements:
- People arriving, often represented by users or unique visitors.
- Visits beginning, represented by sessions.
- Pages opening, represented by pageviews.
A single person can return several times, creating several sessions. During each session, that person can open multiple pages and trigger several interactions. Treating all of those counts as interchangeable creates a misleading story.
Start with the reporting question
If you want to know how large your audience is, users may be the more relevant lens. If you want to understand how often people visit, sessions provide more context. If you want to evaluate a landing page, pageviews, entrances, exits, and conversions help explain what happened after the arrival.
The phrase isn't a formal metric with one universal definition. It works as a conversational umbrella, but a trustworthy report must name the underlying measure. A useful unique website visitors explanation can help teams distinguish a de-duplicated audience count from repeated visits during the same reporting period.
Practical rule: Never approve a traffic conclusion until the report labels the count as users, sessions, pageviews, or conversions.
This framing also improves behavioral analysis. A user behavior analysis guide can help teams move beyond headline traffic and examine paths, interactions, and friction points. For SEO, the distinction affects whether a page is attracting a broad audience or repeatedly serving a smaller group. For UX, it determines whether the problem is acquisition, navigation, comprehension, or the final action.
Understanding the Core Visitor Metrics
A coffee shop makes the vocabulary easier to remember. A visitor is a person, a session is that person's visit, a pageview is a table they sit at, an interaction is an order placed, and a conversion is the completed payment.
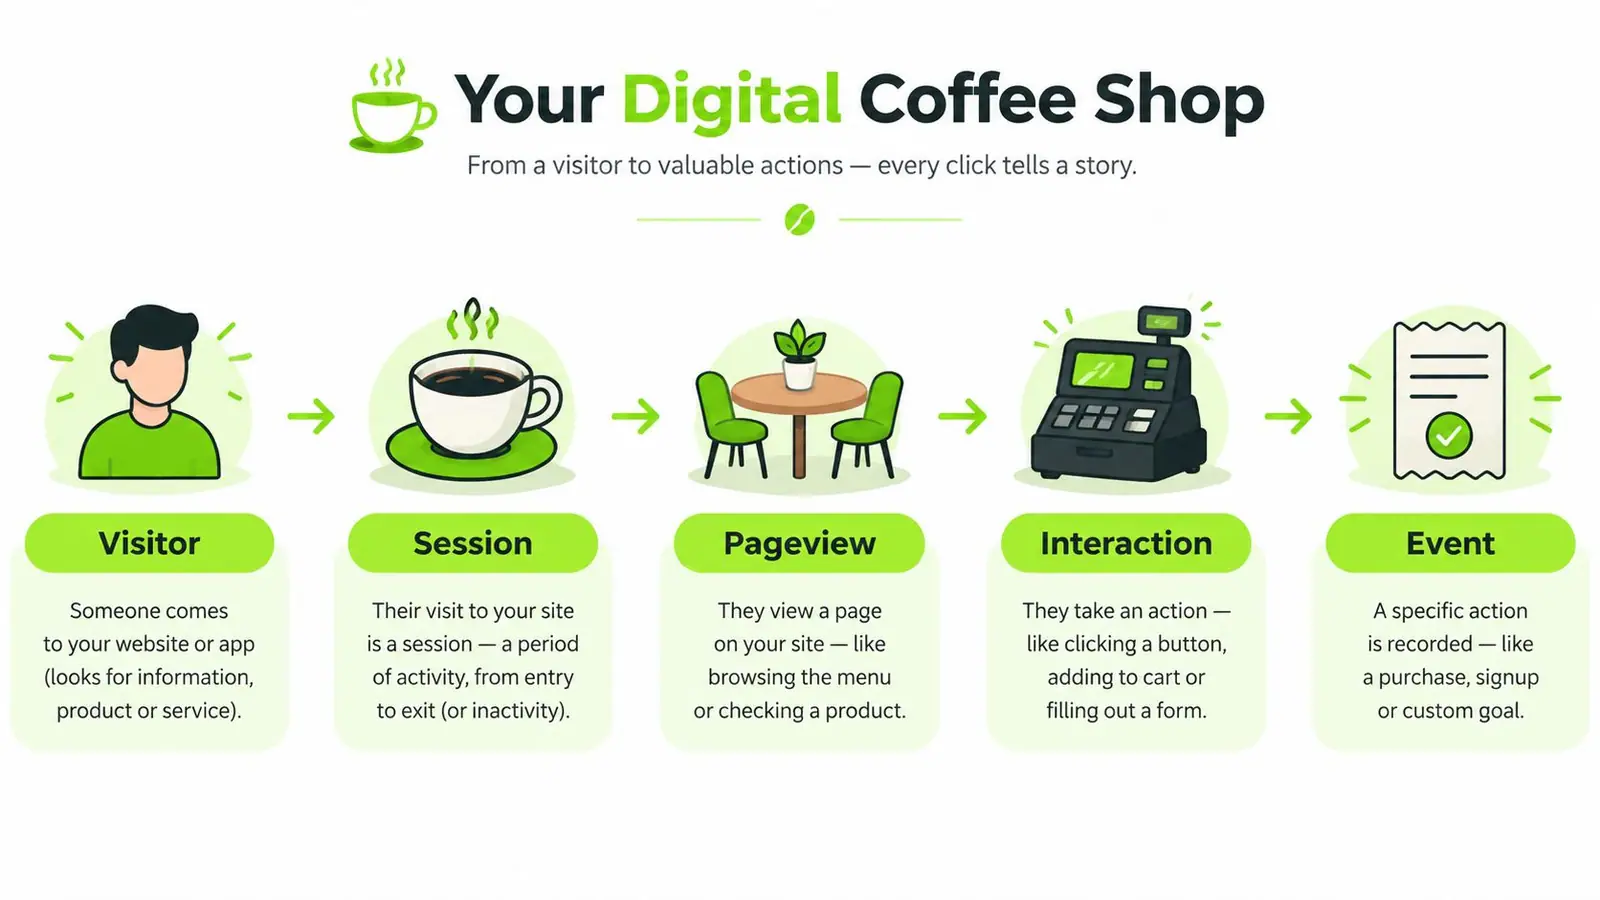
Build the vocabulary in order
Users answer, “How many identifiable people or browsers reached us during this period?” Identification depends on the analytics system and its available signals, so users shouldn't be treated as a perfect census of humans.
Sessions answer, “How many visits took place?” A session usually starts when someone lands on the site and ends after 30 minutes of inactivity, according to the session-based definition described by web analytics guidance on session behavior. One person can create multiple sessions.
Pageviews answer, “How many times did pages load?” A single session may include a homepage, product page, pricing page, and form page. Pageviews show consumption depth, but they don't prove that someone read or understood the content.
Interactions or events answer, “What did people do?” Examples include clicking a call to action, submitting a form, playing a video, or using a site feature. These actions reveal behavior that raw arrival counts can't show.
Conversions answer, “How many people completed the desired business action?” The standard calculation is conversions divided by total visitors, multiplied by 100. For example, 5,000 visits producing 400 conversions equals an 8% conversion rate. The website conversion rate benchmark and formula provides a baseline for interpreting this metric, including a 2026 global average of 2.35% across industries based on analysis of 46 billion sessions.
GA4 emphasizes event-driven measurement, while Universal Analytics used a different reporting model and user identification approach. That means historical comparisons need consistent definitions, filters, and implementation. Public data from analytics.usa.gov includes legacy Universal Analytics reports covering 2018 to 2024, offering a record of the transition between measurement systems.
For physical or connected environments, the same logic applies. Teams reviewing analytics for passwordless WiFi still need to separate people, visits, connections, and actions before deciding what the data means.
Comparing Sessions and Users
A loyal subscriber visits a website five times during a month. One visit happens after a newsletter, another follows a search, and the remaining visits come directly through a bookmark. The analytics report may record several sessions, while the user count rises by only one, assuming the system can recognize the same user consistently.
That example shows why users measure audience size and sessions measure visit activity. Users help answer whether reach is expanding. Sessions help answer whether people are returning, consuming content repeatedly, or encountering the brand through several campaigns.
| Dimension | Total Users | Total Sessions |
|---|---|---|
| Main question | How many identifiable visitors reached the site? | How many visits occurred? |
| Returning behavior | Can understate repeat activity | Captures each recorded visit |
| Useful for | Audience reach and acquisition | Visit frequency and content consumption |
| Main caution | Identification can vary across devices and privacy settings | One person can create many sessions |
Use the gap as a signal
Sessions are more informative when you're evaluating an email campaign, paid landing page, content path, or visit frequency. Users are more useful when you're estimating audience growth, comparing new and returning reach, or explaining how many distinct visitors a channel attracted.
The relationship between the two offers a simple loyalty signal:
Sessions per user = total sessions ÷ total users
A widening gap can indicate stronger repeat visitation, but it can also reflect campaign repetition, accidental reloads, or measurement differences. Treat it as a prompt for investigation, not a loyalty verdict.
Channel classification can add another complication. Teams analyzing traffic from AI tools may need understanding AI Assistant reclassification before comparing channel trends. A change in classification can move sessions between groups without changing the underlying visits.
Before trusting any trend, confirm that the Google Analytics tracking code is installed consistently and that the reporting system uses comparable identity and session settings.
Interpreting Engagement Signals
Three metrics often appear beside visitors on site: average session duration, bounce rate, and dwell time. They don't measure the same thing, so a dashboard isn't giving you three competing opinions. It's showing different clocks and behaviors.
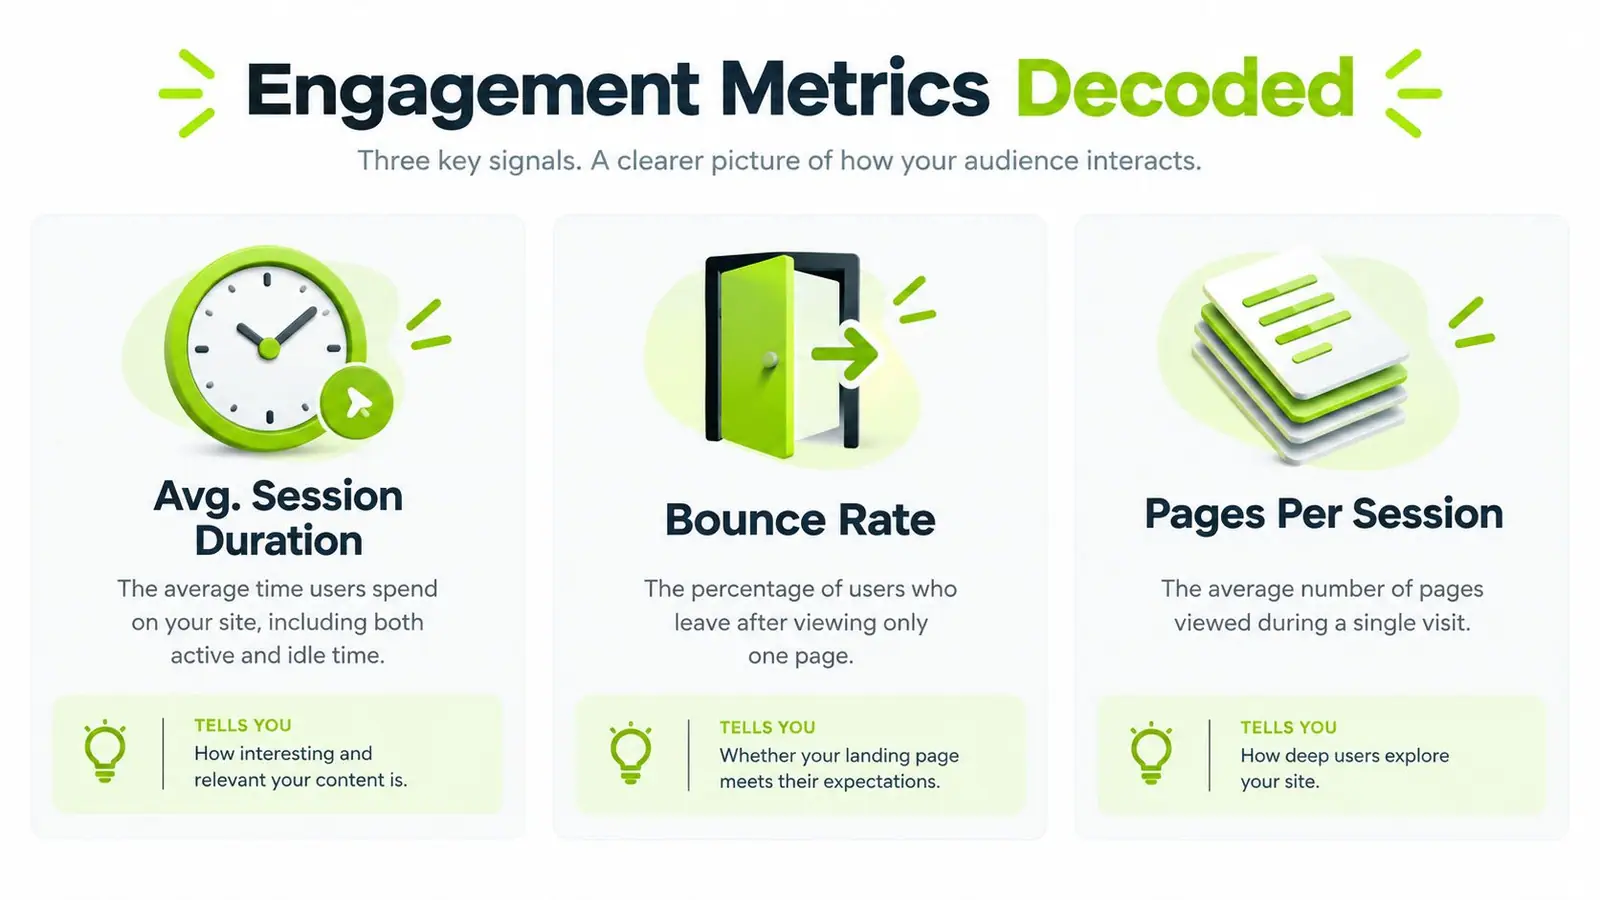
Average session duration measures time associated with a visit, but it can mix active reading with an open tab that someone has left idle. A two-minute average doesn't prove two minutes of attention.
Bounce rate identifies sessions with one pageview and no meaningful interaction. It isn't a quality verdict. Someone may find the answer on a single article and leave satisfied, while another person may abandon a confusing product page after seeing only one screen.
Dwell time belongs to the search-results journey. It describes how long a search result held attention after the click, before the user returned to the results page. It shouldn't be treated as the same measurement as time spent across a website session.
Consider a product page with a two-minute average session duration, a 65% bounce rate, and a 90-second dwell time. The duration might suggest some visitors explored carefully. The bounce rate could indicate that many visitors found enough information on the product page, or that the page failed to guide them onward. The dwell time might suggest that the search snippet and landing experience held attention for part of the journey, but it still doesn't reveal whether the visitor requested a demo.
Read the page's job before judging the number
A long-form article may succeed when visitors consume one page and leave with their question answered. A checkout page has a different job. A single-page checkout session may be perfectly healthy if payment completes, but alarming if users abandon before submitting.
Category expectations provide context. Ecommerce and B2B sites often see average bounce rates around 41% to 55% and 25% to 55%, respectively, while content sites can reach 60% to 90%, according to web analytics benchmarks for 2026. For a 1,500-word article, roughly 2 to 3 minutes of engagement is commonly used as a practical reference, while under 30 seconds can indicate immediate abandonment.
Use these signals together with page purpose, source, device, and conversion behavior. If you optimize bounce rate alone, you may encourage unnecessary clicks instead of helping visitors complete their task. A bounce rate explanation for Google Analytics can provide a useful reference when teams disagree about what a single-page session means.
Avoiding Common Analytics Reporting Pitfalls
Visitor counts can change because the audience changed, or because the measurement changed. Those causes look similar in a line chart, but they require completely different responses.
A date-range mismatch is an easy example. Comparing a holiday week with a regular week can make normal seasonality look like a sudden gain or loss. Comparing paid and organic traffic without aligning attribution rules can create another false conclusion, especially when one segment includes campaign-tagged visits and the other includes unclassified traffic.
Consent also affects the visible record. If visitors decline analytics cookies, the tracked session total may fall even while organic search activity rises. That doesn't mean the search channel stopped working. It means the analytics system has less permission to observe it.
Audit the measurement before interpreting the trend
Duplicated tracking codes can inflate pageviews and events. Cross-domain contamination can join activity from separate properties or introduce referral patterns that don't match the customer journey. A default channel-group change can also reclassify sessions, making one source appear to surge while another appears to shrink.
| Pitfall | Distorted Visitor Pattern | Verification Step |
|---|---|---|
| Date-range mismatch | A normal seasonal shift looks like growth or decline | Compare equivalent periods and annotate campaigns |
| Missing consent | Tracked sessions fall while other evidence shows continued demand | Review consent rates and regional reporting |
| Duplicated tagging | Pageviews or events rise without a matching business outcome | Test tag firing and inspect implementation |
| Cross-domain contamination | One journey appears as traffic from an unrelated property | Check referral exclusions and hostnames |
| Channel reclassification | Sessions move between source groups overnight | Review channel definitions and release notes |
A practical pre-report routine should be short enough to follow every time:
- Confirm dates, time zone, and comparison period.
- Review filters, segments, and internal traffic exclusions.
- Check consent behavior by relevant region.
- Test tags, events, and form submissions.
- Inspect cross-domain and referral settings.
- Compare source labels before explaining a sudden movement.
Teams working across platforms can also review common data integration challenges before combining visitor reports with CRM, advertising, or product data. A clean dashboard can't rescue incompatible inputs.
Turning Visitor Trends Into SEO and UX Decisions
Traffic becomes actionable when you read it through four layers. Start with quantity, add quality, connect both to conversion, then finish with the business outcome.
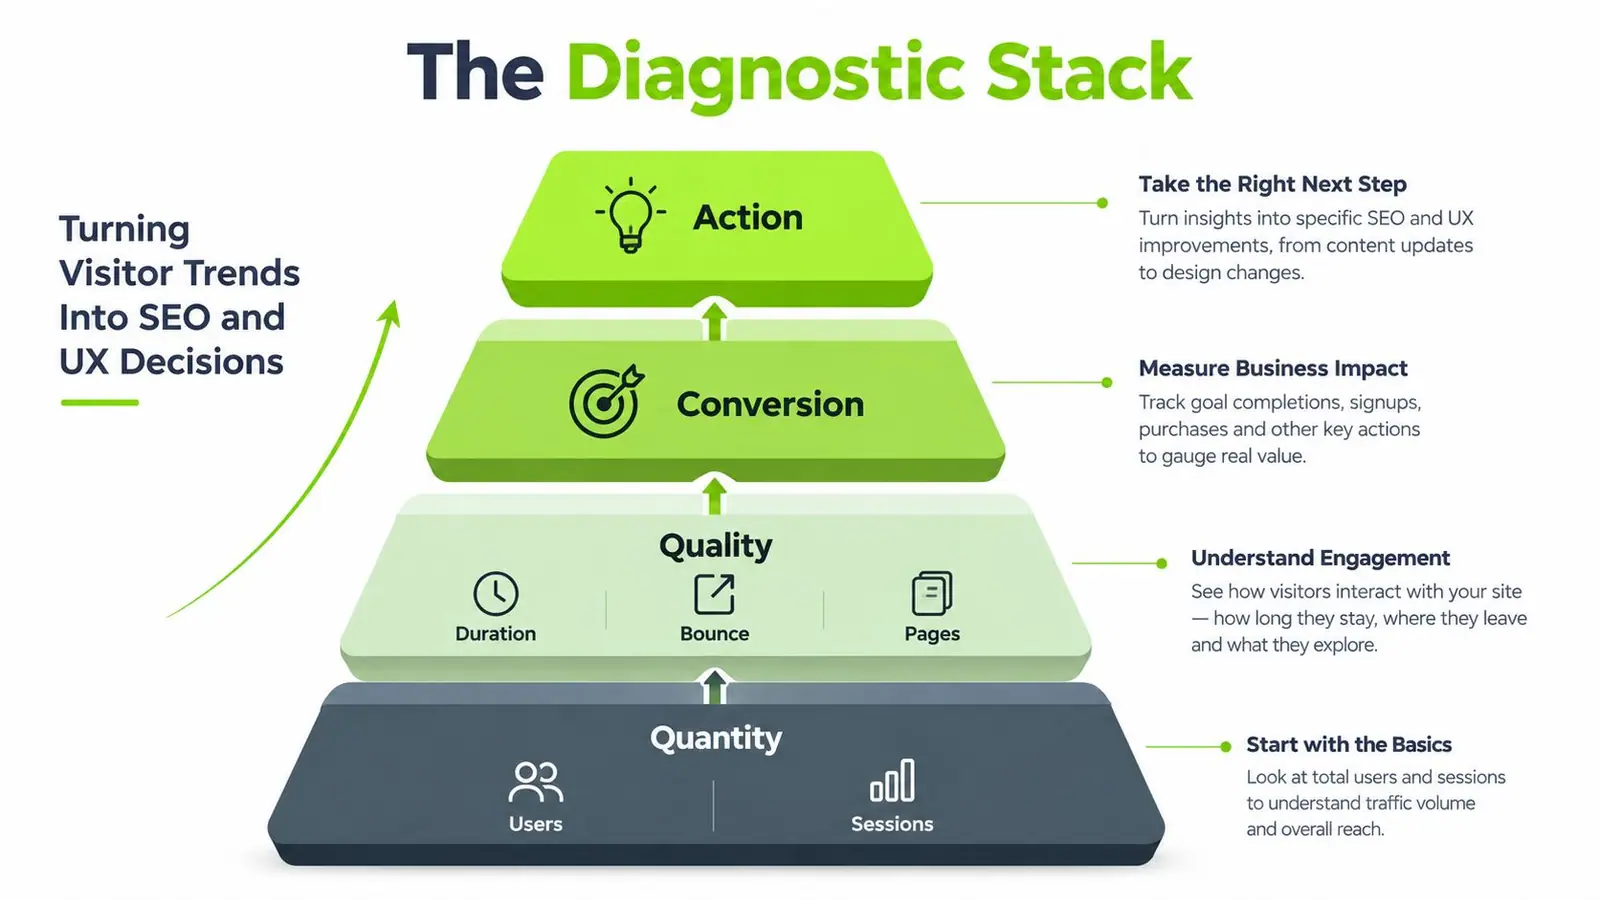
Layer one measures arrival volume
Review users and sessions by source, landing page, device, and period. This tells you whether SEO, paid media, email, or referral activity is bringing more activity to the site. It doesn't tell you whether the visitors found the right answer.
Layer two tests the visit quality
Add duration, bounce rate, pages per session, and meaningful events. Segment these measures by landing page and query intent where possible. A page can attract substantial search traffic and still disappoint visitors if the headline promises something the content doesn't deliver.
Layer three connects behavior to action
Bring conversion rate into the same view. The standard calculation is conversions divided by total visitors, multiplied by 100, so teams can compare traffic quality with lead generation or sales activity. The 2026 benchmark of 2.35% average conversion, alongside 5.31% or higher for top-performing sites and 11.45% or above for the top 10%, shows why volume alone doesn't define success. These benchmark figures are documented by Geckoboard's website conversion rate reference.
Layer four chooses the next action
Suppose organic sessions rise by 20%, average duration falls, and conversions remain flat. That pattern points toward an intent and landing-page mismatch, not an automatic reason to celebrate SEO growth. Audit the search terms, title and description, first-screen copy, page speed, internal links, and conversion path.
Other combinations lead elsewhere:
- Sessions rise and engagement stays steady: SEO traction may be healthy. Check whether conversions and qualified leads follow.
- Sessions fall while average order value rises: The audience is smaller but may be more valuable. Protect the pages and channels attracting those visitors.
- Quantity is low and engagement is weak: Improve acquisition targeting, topic coverage, and first-visit clarity.
- Quantity is high and engagement is weak: Investigate page-level UX, message match, and device experience.
- Engagement is strong but conversion is low: Look for funnel friction, unclear calls to action, form problems, or weak offer alignment.
This approach keeps SEO and UX connected. Search brings the arrival, the page earns the interaction, and the funnel determines whether that interaction becomes a business result.
A Practical Visitor Trend Decision Checklist
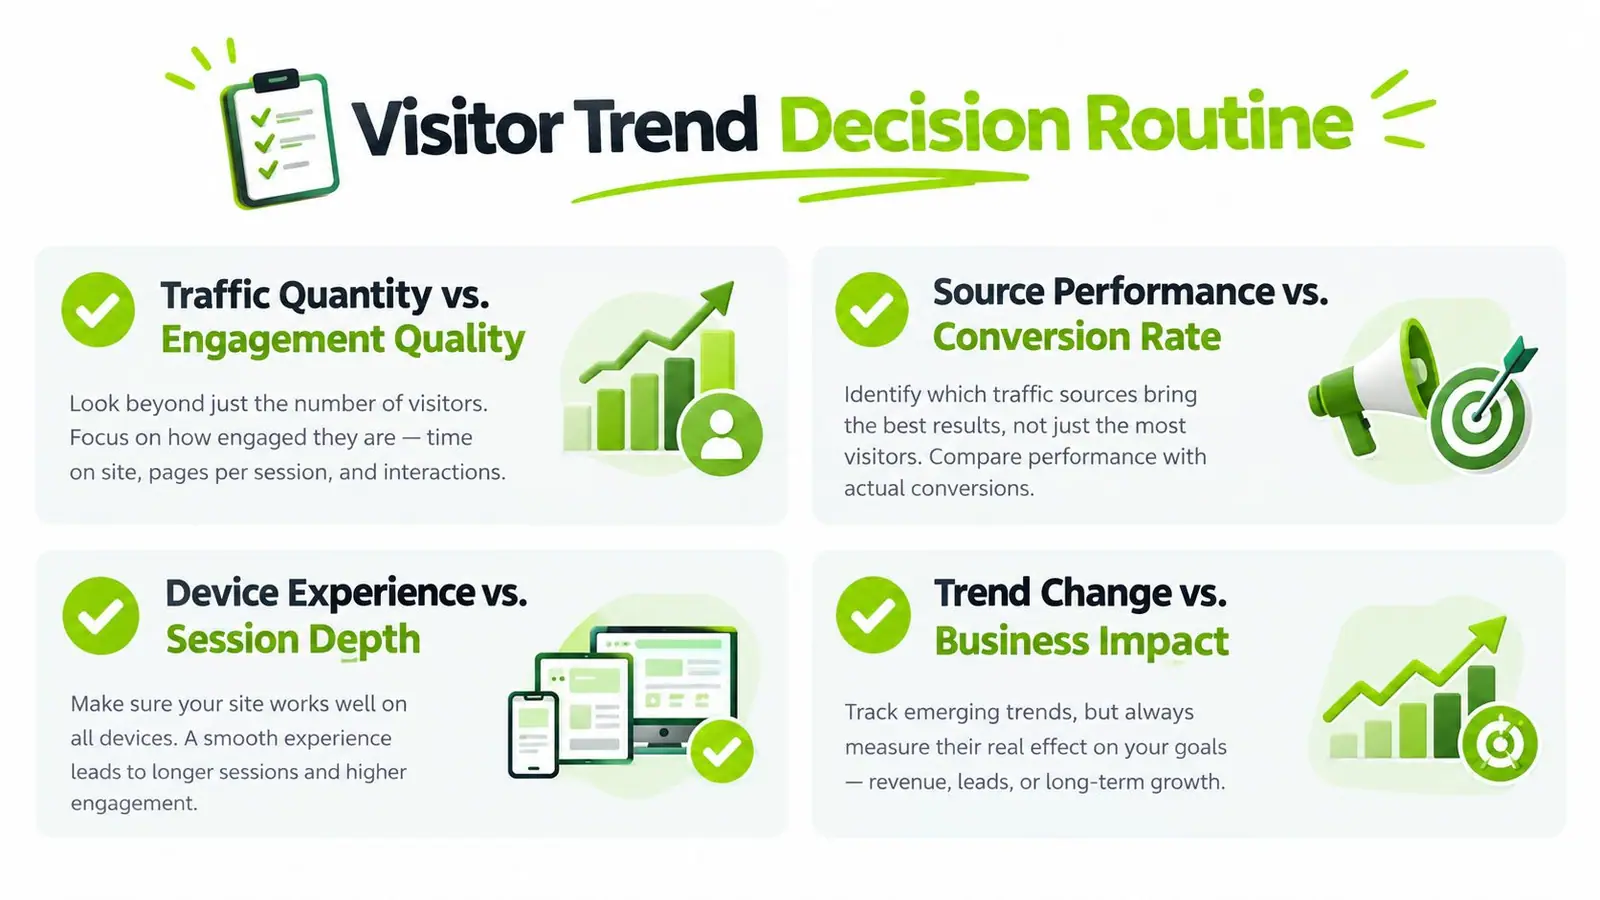
A junior analyst can turn a raw visitors-on-site report into a useful conclusion by checking paired signals in sequence.
-
Traffic quantity versus engagement quality: Compare users and sessions with duration, bounce rate, and pages per session by landing page. Rising arrivals with weakening engagement deserve a page or intent review.
-
Returning users versus new users: Segment the audience and compare visit frequency, content depth, and conversions. Strong returning activity with weak new-user performance may indicate that acquisition messages overpromise or onboarding is unclear.
-
Landing-page performance versus site-wide flow: Rank landing pages by entrances, engagement, and conversions, then inspect the next step in the journey. A page may perform well alone but lose visitors at navigation, pricing, or form stages.
-
SEO-driven traffic versus conversion outcomes: Compare organic sessions with conversion rate and qualified leads. More search traffic without stronger outcomes calls for query-intent, content, and funnel analysis rather than more publishing by default.
Match the review to the reporting cadence
Weekly, check major anomalies, tracking health, campaign launches, device behavior, and top landing pages. Keep the review focused on detection.
Monthly, compare equivalent periods and evaluate sources, users, sessions, engagement, conversions, and page-level movement. This is the right rhythm for content updates, UX tests, and campaign adjustments.
Quarterly, reassess channel quality, returning behavior, conversion paths, SEO priorities, consent coverage, and business outcomes. Use the longer view to decide which trends deserve investment and which reflect temporary noise.
The best stakeholder report doesn't say that visitors increased or declined. It explains who arrived, how often they visited, what they did, whether they converted, and what the team should change next.
Surnex brings AI visibility tracking together with SEO metrics such as rankings, backlinks, audits, content opportunities, and citation gaps, helping agencies and in-house teams connect search visibility with visitor outcomes. Visit Surnex to see how a unified view can support clearer reporting and more focused SEO decisions.