
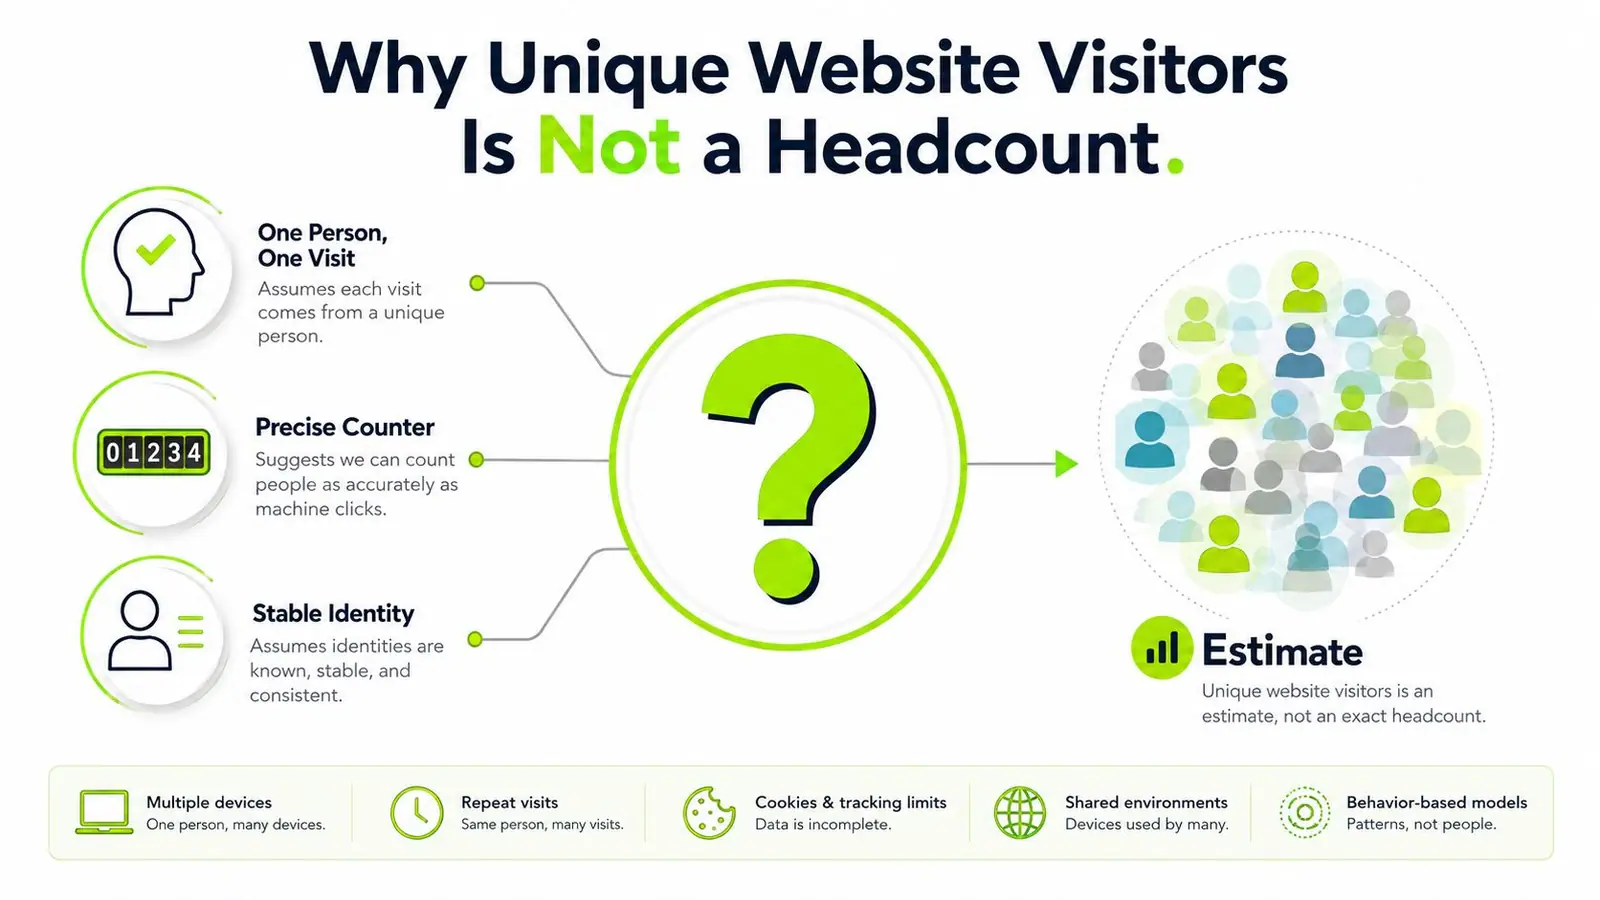
Most guidance treats unique website visitors as a clean count of the people who reached a site. That's the wrong mental model. The metric is useful, often indispensable, but it isn't a census of humans. Cookies expire, devices split identities, consent settings remove signals, and increasingly, people discover brands through AI experiences without visiting the website at all.
A better approach is to treat the number as an estimated reach signal. Use it to understand direction, compare consistent reporting periods, and test whether audience exposure is expanding. Don't use it as an unquestionable headcount in a board presentation or client forecast.
Why Unique Website Visitors Is Not a Headcount
Unique website visitors means a de-duplicated audience count for a selected reporting period. If one person visits repeatedly during that period, the platform aims to count that person once, rather than counting every visit or page view. That makes the metric more useful for measuring reach than raw visits, sessions, or page views, as explained in Similarweb's definition of unique visitors.
The historical logic is simple, and it's still valuable: count individuals instead of hits. One visitor might read several articles, return through an email, and revisit after a search query. Those actions matter for engagement, but they shouldn't make the audience appear larger every time the same person comes back.
The useful part of the metric
Unique visitors separates audience size from engagement depth. Sessions tell you how often visits occurred. Page views tell you how much content people loaded. Unique visitors gives you a directional answer to a different question, how broadly the site reached people during the selected window.
That distinction helps when comparing campaigns, content programs, markets, or reporting periods. If a campaign produces more page views but roughly the same unique visitor trend, it may be increasing repeat consumption rather than expanding reach. Neither result is automatically better, but they describe different outcomes.
Practical rule: Use unique visitors to discuss reach, and use sessions, page views, and engagement metrics to discuss what that audience did.
Why the number is still an estimate
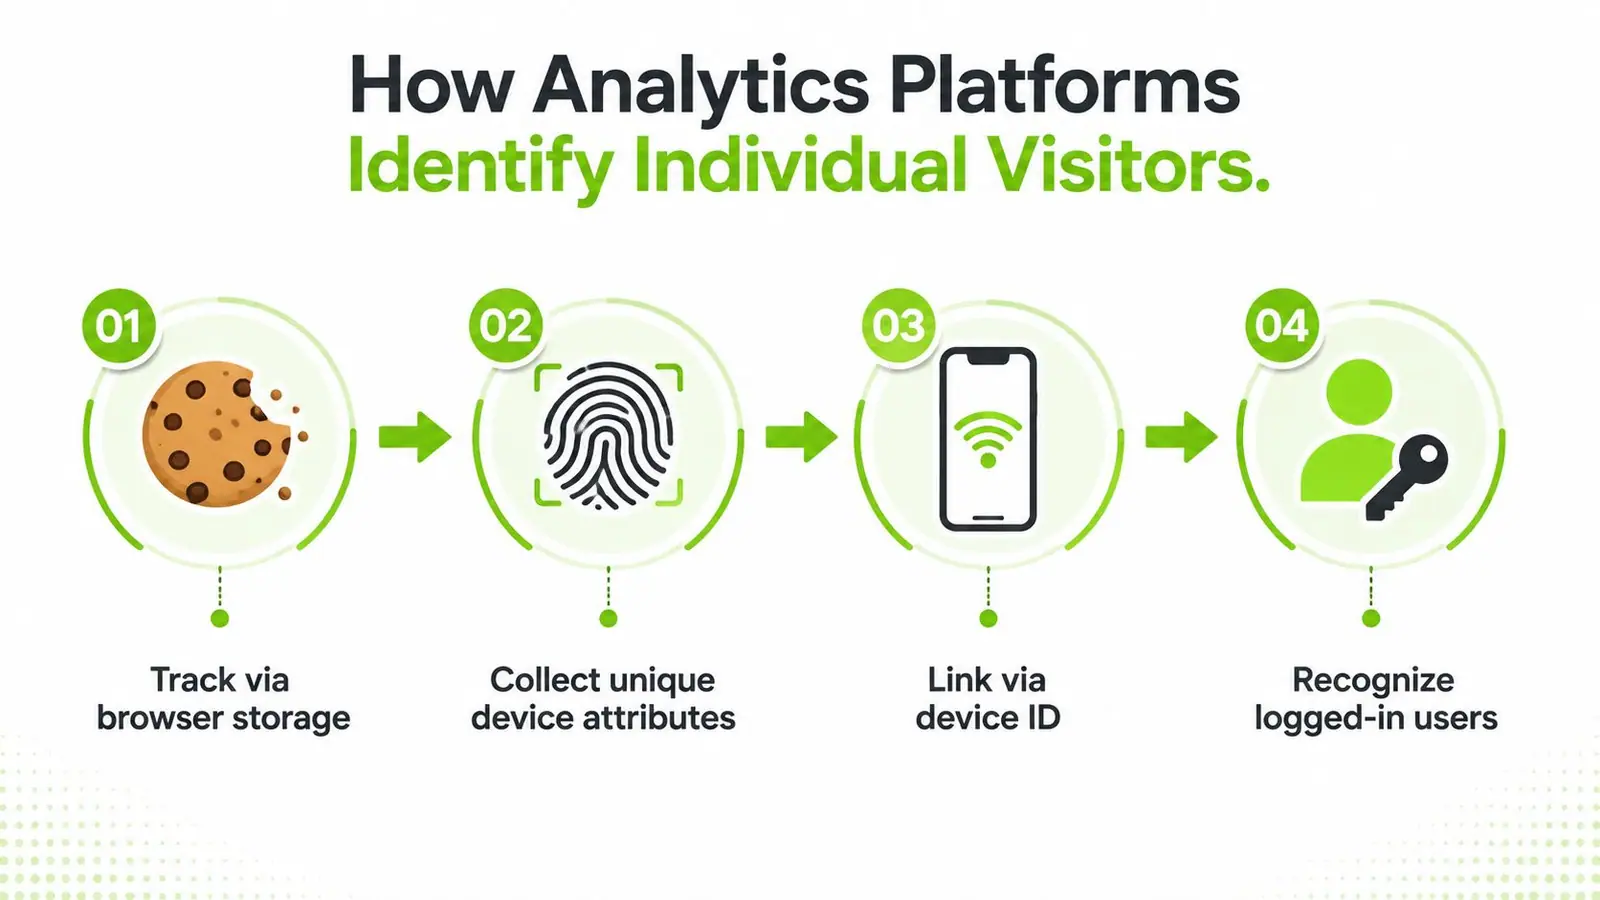
Analytics platforms usually infer visitors from identifiers such as cookies, browser IDs, device-linked IDs, or logged-in signals. Those identifiers represent a browser, device, or recognized account, not necessarily one verified human. A person can appear more than once, while another person may never appear because tracking was blocked or consent wasn't granted.
That's why absolute values deserve caution. The strongest use case is trend analysis across comparable periods, with stable tracking and consistent filters. For a broader framework on interpreting audiences beyond traffic totals, see this guide to audience analysis.
How Analytics Platforms Identify Individual Visitors
Analytics systems recognize signals, not people in the abstract. The easiest analogy is a physical shop where staff try to remember customers. A loyalty card provides a strong identity signal. A familiar face offers a weaker one. A customer who changes clothes, enters through another door, or refuses the loyalty program becomes harder to identify consistently.
Web analytics works in much the same way. The platform receives an identifier, associates activity with it, and attempts to avoid counting the same identifier repeatedly within the reporting period.
The main identification signals
Cookies store a browser-linked identifier. When the same browser returns, the analytics tool can associate the activity with the previous identifier. This method is practical, but it doesn't know whether several people share that browser or whether one person uses another browser.
Device or browser attributes can provide additional context about the environment. These signals may help platforms distinguish visits, but they raise privacy concerns and still don't guarantee that the system has identified one human correctly.
Unique IDs and visitor IDs give the analytics platform a consistent value to use for de-duplication. The result remains an estimate tied to the quality and persistence of the identifier.
Logged-in user signals can provide stronger matching because the same account may be recognized across visits and, where a platform allows it, across devices. That improves identity resolution for authenticated experiences, but it covers only users who log in and must be implemented with appropriate consent and data governance.
The core distinction is important. AgencyAnalytics defines unique visitors as a de-duplicated count based on browser or device-linked identifiers, not as a replacement for sessions or page views.
For teams building a wider measurement stack, a practical overview of profitable metrics for 2026 can help place visitor reach alongside commercial indicators. The metric itself won't explain whether traffic created value. It only tells you how many recognized identities appeared within the chosen reporting window.
Here's a technical walkthrough for teams reviewing their implementation:
Accuracy versus privacy
Every identification method involves a trade-off. Stronger identity resolution generally requires more persistent signals or authenticated relationships. Privacy controls intentionally make those signals less available, which is a legitimate design outcome, not merely an analytics defect.
Teams should therefore ask what the number represents in their own setup. Is it cookie-based browser reach? Recognized logged-in users? A blended estimate? Without that definition, two reports can use the same label while measuring different populations.
Implementation details also matter. A tracking configuration review, including Google Analytics tracking code, should confirm that the relevant pages send consistent signals and that consent behavior is reflected in the reporting interpretation.
Universal Analytics Versus GA4 Visitor Counting
Universal Analytics and GA4 don't produce interchangeable audience totals. They use different reporting models, identity settings, and processing logic, so a historical comparison can look like a data-quality problem even when both properties are working as configured.
Universal Analytics centered its reporting around sessions and a user concept that was strongly associated with browser-based identification. GA4 uses an event-driven structure and can combine several identity methods, including device-based signals, User-ID, and Google Signals where available and permitted.
| Feature | Universal Analytics | GA4 |
|---|---|---|
| Core measurement model | Session and hit-based reporting | Event-based reporting |
| Visitor identity | Primarily browser-linked user identification | Blended identity options, depending on configuration |
| Cross-device recognition | Limited without additional identity signals | Stronger where User-ID or eligible Google Signals are available |
| Reporting baseline | Legacy user and session definitions | GA4 user, active user, session, and event definitions |
| Best comparison method | Compare within the same UA property and setup | Compare within the same GA4 property and consistent configuration |
Why the baselines differ
A migration changes more than the interface. It can change which events fire, how sessions are formed, how consent affects collection, and which identity spaces are available. Even if the website and date range stay the same, the resulting visitor estimate may not match the old platform.
That doesn't mean one number is automatically correct. It means the numbers answer questions through different measurement systems. A stakeholder asking why GA4 doesn't reproduce a Universal Analytics total needs an explanation of the methodology, not a promise that the platforms will reconcile perfectly.
Use a transition report that shows each platform separately. Label the change in collection and definitions, then establish a new GA4 baseline rather than blending the two systems.
What to communicate internally
Avoid statements such as “GA4 lost visitors” unless you've investigated implementation, consent, filters, and identity settings. A safer explanation is that the organization changed its measurement system and should use GA4 trends within GA4.
The same discipline applies to engagement metrics. If your reporting includes bounce rate, clarify the platform definition before drawing conclusions. Teams reviewing that specific metric can use this explanation of bounce rate in Google Analytics as a reference point.
A clean report should include the property, date range, filters, identity settings, and comparison method. Without those details, a single visitor total has too little context to support a confident business conclusion.
When Unique Visitor Counts Break Down
The most common reporting error is treating a browser identifier as a human identity. Consider a buyer who first researches a product on a phone, continues on a work laptop, and later returns through a home browser. If the site can't connect those environments, the same person may appear as several unique visitors.
That's identity fragmentation. Cookies are tied to browsers and devices, so switching environments, deleting cookies, or blocking consent can split one real user into multiple measured identities. The Siteimprove explanation of visits, page views, and unique visitors recommends treating the absolute value carefully and paying closer attention to trends.
Common failure scenarios
Shared devices create the opposite problem. Several people may use one household or workplace browser. The platform can group their activity under one identifier, making the audience look smaller than the number of actual people.
Private browsing and cookie deletion interrupt continuity. A visitor may return with a fresh identifier, or the platform may be unable to connect the return visit to the earlier activity. The report can show several apparent visitors where there was one person.
Consent choices reduce observable traffic. If a visitor declines analytics storage, the platform may not create the same persistent identifier it would have used after consent. The result is not necessarily missing human interest. It may be missing measurement permission.
Ad blockers and browser protections remove signals. Some tools prevent analytics scripts from loading or restrict storage behavior. Privacy-focused browsers can therefore create a different measurement profile from browsers with fewer restrictions.
How to explain the uncertainty
Don't tell leadership that unique visitors are “wrong” without context. Explain that the number is an estimate whose reliability depends on identity continuity, consent coverage, device behavior, and implementation quality.
Use this language: “The trend is suitable for directional reach analysis, but the total shouldn't be interpreted as an exact count of people.”
Trust the metric more when the comparison uses the same property, filters, date logic, consent configuration, and campaign context. Trust it less when you're comparing different platforms, markets with different privacy behavior, or audiences that frequently move between devices.
AI Discovery and the Changing Meaning of a Visit
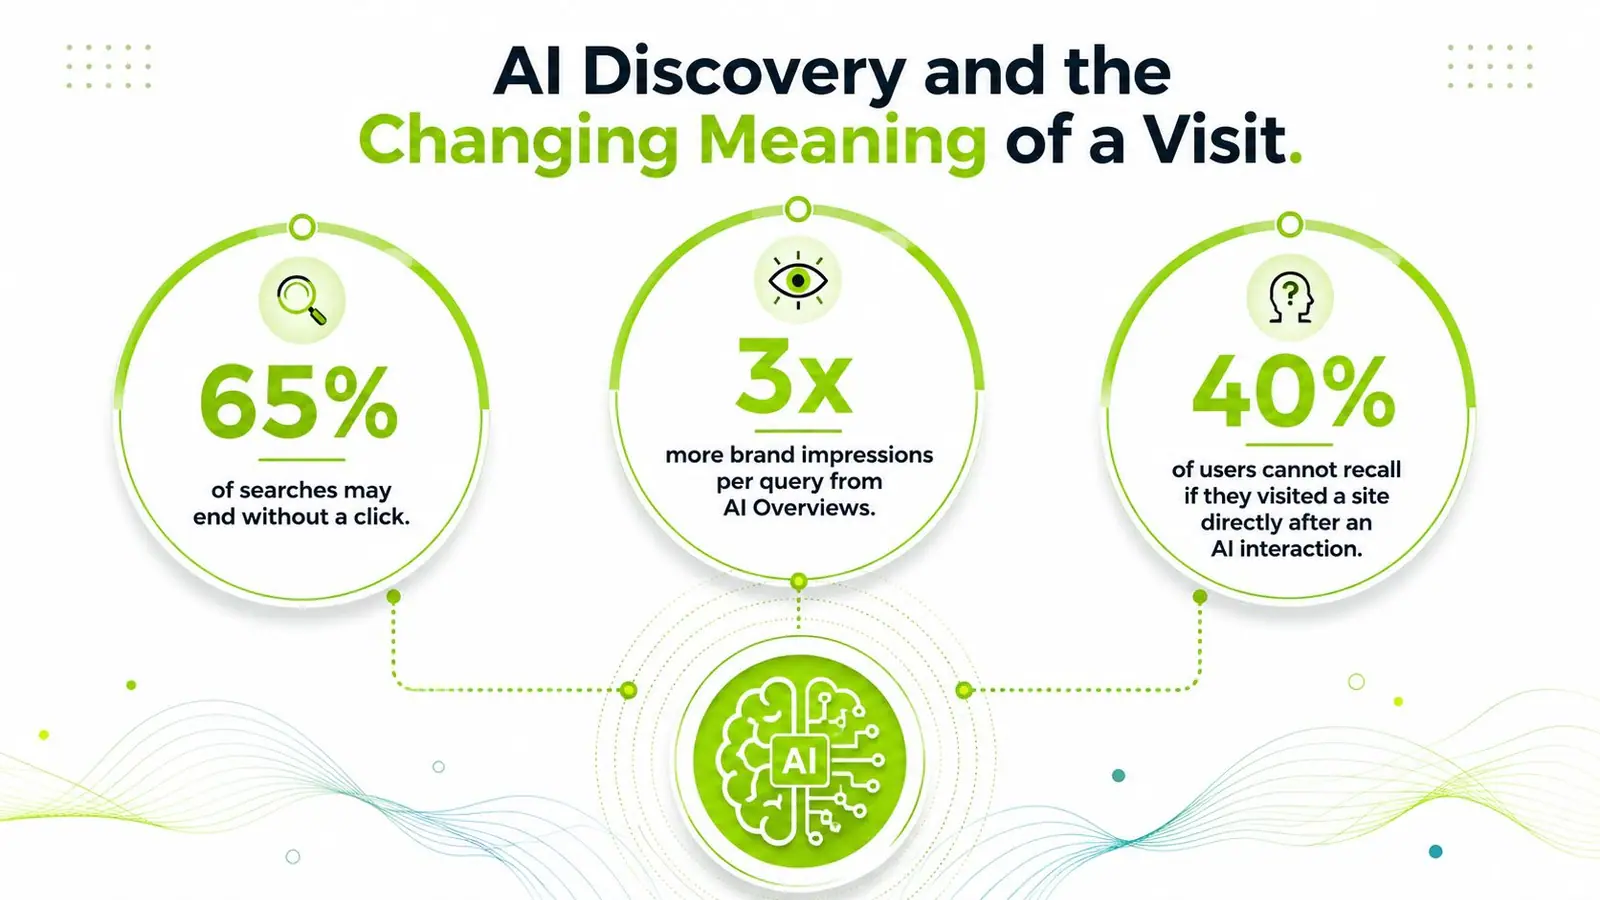
A website visit now represents only one part of discovery. Search engines and AI assistants can expose a brand, explain its category, summarize its content, or recommend its product before a person clicks through. Traditional analytics records the landing event, but it usually can't count the person who saw the answer and never opened the site.
The scale of these discovery surfaces makes the gap harder to ignore. According to the Digital 2026 mid-year global update, ChatGPT reached about 460 million unique monthly visitors in February 2026, while Google averaged about 3.19 billion unique monthly visitors between December 2025 and February 2026. Those figures describe the platforms' audiences, not your brand's reach, but they show why discovery is distributed across more than a website.
A visit is no longer the whole journey
A person might encounter your brand in an AI-generated answer, remember the name, and return through direct navigation later. Another person may compare several vendors inside an assistant and never visit any of their websites. Both experiences can influence demand, yet only the first eventual landing is visible in on-site unique visitor reporting.
That creates a measurement gap between discovery, consideration, and site arrival. Unique website visitors remains useful for the final stage, but it can't represent all the people who encountered your brand earlier in the journey.
Teams should pair site analytics with visibility evidence from search and AI environments. An AI Overview tracker can help teams monitor whether a brand appears in these surfaces, which queries create exposure, and where citations or mentions are absent.
What to change in reporting
Add an off-site visibility layer rather than forcing every discovery event into a visitor metric. Track brand presence, citations, query coverage, and the relationship between visibility changes and later direct or organic traffic.
Don't add unverified AI impressions to unique visitor totals. That would replace one estimate with another and make the report harder to interpret. Keep the measures separate, then explain how they fit together in the full funnel.
Best Practices for Measuring Unique Visitors Accurately
Accuracy starts before the dashboard. A team can't interpret unique visitors responsibly if its tracking code fires inconsistently, consent states disappear from the data, or multiple properties report overlapping traffic without a defined ownership model.
Use the following operating checklist to improve consistency without pretending that the metric can become a perfect headcount.
Start with consent and identity design
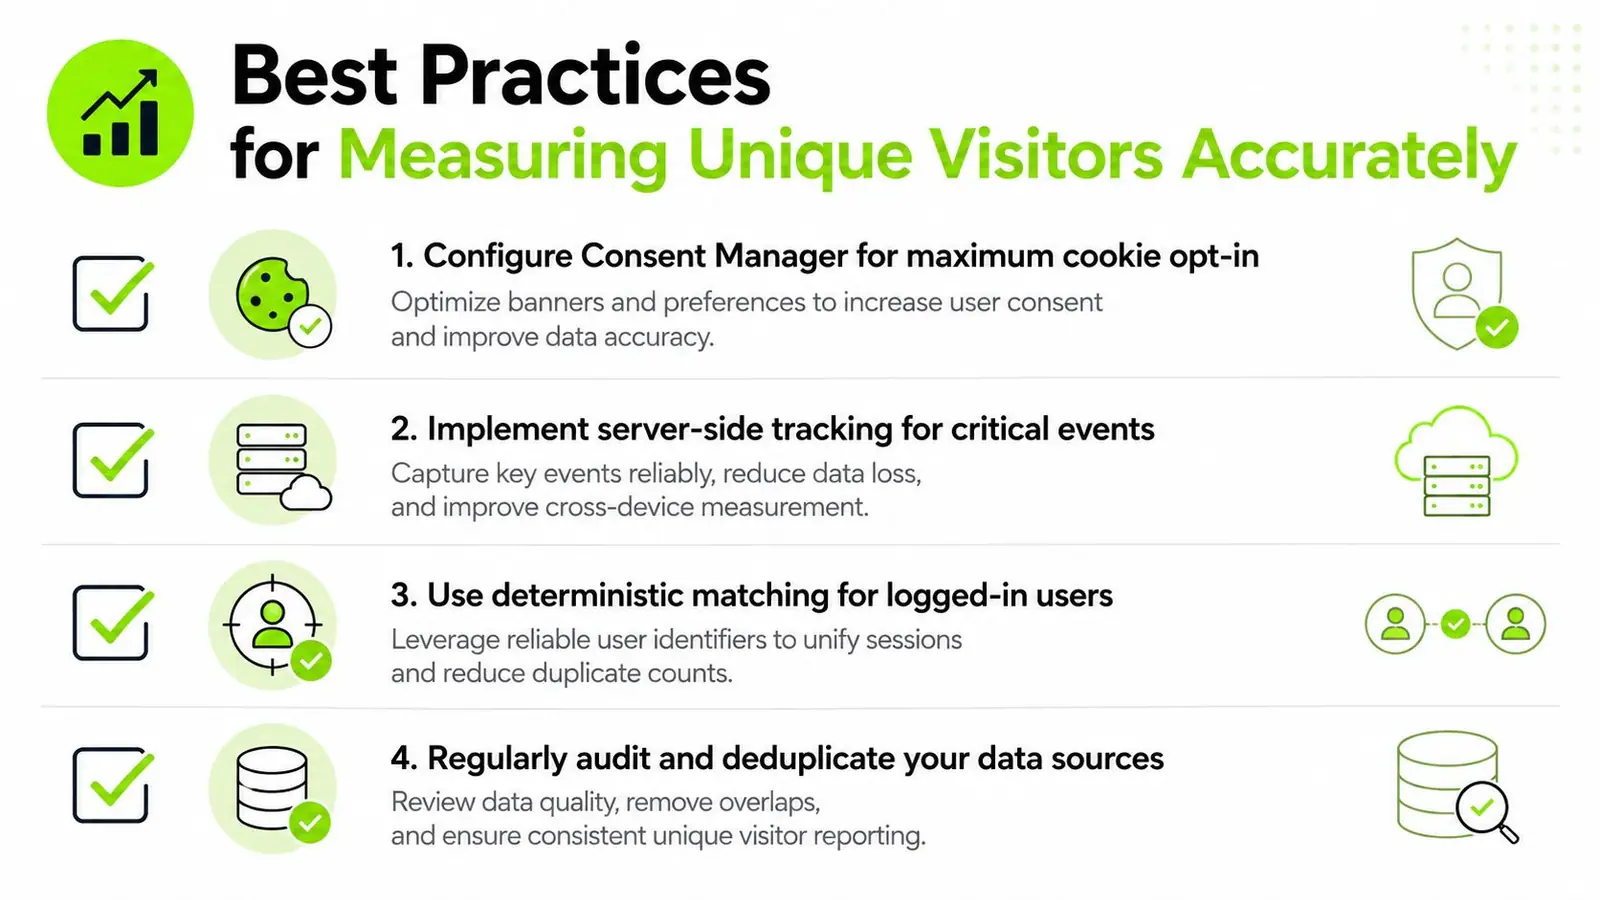
Configure consent management carefully. Make sure the consent manager communicates the visitor's choice to the analytics platform and that reports distinguish observed traffic from traffic affected by missing consent. Increasing observable coverage can improve continuity, but it must never come at the expense of valid consent.
Use deterministic matching for authenticated users. Where users log in, a permitted User-ID approach can connect activity more reliably than anonymous browser identifiers. Keep anonymous and authenticated reporting clearly separated so stakeholders understand which audience each view represents.
Document the identity rules. Record which signals the platform uses, how long they persist, how cross-device matching works, and what happens after a visitor declines or withdraws consent. This documentation becomes essential when a platform update changes the total.
Improve collection quality
Audit the implementation across templates and subdomains. Check that the tracking code is present where intended, that duplicate tags aren't sending duplicate events, and that campaign parameters don't create confusing source splits.
Use server-side collection for critical events where appropriate. Server-side tracking can make important conversion events more resilient to browser restrictions, but it doesn't automatically solve anonymous user identity. Treat it as a collection improvement, not a universal de-duplication fix.
Keep reporting windows consistent. Compare like with like. Use stable date ranges, filters, properties, markets, and consent settings before interpreting movement as audience growth or decline.
Read trends instead of isolated totals
Analytics vendors recommend relying more on trend direction than absolute unique-visitor values because privacy settings and cross-device behavior can change the estimate. Review the metric over repeated comparable periods and annotate changes in implementation, consent, campaign mix, and site architecture.
Measurement discipline: A stable method over time is often more valuable than a theoretically precise number you can't reproduce next month.
Building a Modern Audience Reporting Framework
Unique visitors belong in the audience portion of a report. They estimate how many recognized identities appeared during a period, but they do not measure repeat frequency, engagement, content influence, or people who discovered the brand without visiting the site. Cookies, device switching, consent choices, and AI-driven discovery can all widen the gap between the reported total and the actual audience.
A useful report answers four separate questions:
- How broad was observed reach? Show unique visitors, and document the identity method and its limitations.
- How much activity did that audience create? Add sessions and page views to reveal return behavior and content consumption.
- Did the audience engage? Track engaged sessions, meaningful events, form interactions, or other defined actions.
- How did discovery happen outside the site? Include organic visibility, AI mentions, citations, and other off-site signals where measurement is available.
A report structure that survives scrutiny
For agency clients, lead with trend charts for unique visitors and sessions. Segment them by channel, geography, device, and landing page so changes have usable context. Place a short methodology note beside the chart rather than hiding it in an appendix. State that the visitor figure is an estimate, then record material changes to tracking, consent, or reporting settings.
For in-house leadership, connect observed reach with business outcomes. Show whether visitors reached priority pages, returned through branded search, completed important events, or entered a known customer journey. A large reported audience with weak engagement may call for a content or targeting decision, not a congratulatory headline.
Executive views can follow practical guidance on how to build better SEO client dashboards while keeping definitions visible and comparisons consistent.
The practical decision rule
Use unique visitors to identify direction, not to claim exact market penetration. Confidence in a reach trend increases when visitor growth appears alongside sessions, engaged behavior, qualified conversions, and off-site visibility. If the visitor total changes alone, check identity settings, consent, campaign mix, and implementation before assigning a business cause.
Treat the metric as one part of a measurement system. Integrate off-site visibility into the existing audience report, then layer in engagement and conversion metrics to show whether discovery produced meaningful outcomes. Keep headcount claims separate from directional estimates, and preserve the same definitions and reporting windows so the next comparison remains interpretable.