You're in the client meeting that happens after a flat traffic report and a confusing AI audit. The dashboard hasn't moved much for months, yet the competitor keeps showing up in ChatGPT, Perplexity, and now even in the snippets your team assumed were “safe.” That gap is why share of visibility matters, because the old way of reporting visibility was built for a web where people mostly clicked one list of blue links, not a search world where answers are assembled across engines, citations, and features.
A good way to think about it is this, share of visibility is not just “how often you show up.” It's how much of the category's attention you capture across the places people look, and that includes Google, AI answers, and the surface where the user makes the decision before the click. If you care about how search connects to revenue, a useful companion read is connecting SEO to pipeline, because visibility only matters when it can be tied to business movement.
Why One Number No Longer Tells the Whole Story
The problem with one neat percentage is that it hides where attention happens. A client can see a flat organic line and assume nothing's changing, while the brand is losing ground in Perplexity answers, AI overviews, and citation panels that never show up in a legacy rank tracker. That's not a measurement issue, it's a surface issue.
The reporting stack changed faster than most dashboards
Google still matters, but the way people encounter results changed as answer engines and grounded AI interfaces became part of the normal search path. Search visibility no longer lives only in ten blue links, and it definitely doesn't live only in position-based reports. A top organic ranking can be less valuable than a cited answer, while a lower-ranked page can still be the source users trust if it gets pulled into the response.
That's why a single share-of-voice number, even from a strong tool, can be misleading. It may tell you the brand is present somewhere, but not whether it's present where readers stop scrolling. In practice, one percent in a prominent answer surface can matter more than several percent spread across invisible lower positions.
The right mental model is to treat visibility as platform-dependent. Google, Perplexity, Claude, and Gemini don't surface the same sources in the same way, so one total can blur the story. If you're reporting to clients, the question isn't just “Are we visible?”, it's “Visible where, in what format, and against which competitors?”
Practical rule: report the surface first, then the composite. If you start with one blended number, you'll miss the source of the change.
Defining Share of Visibility Beyond a Simple Percentage
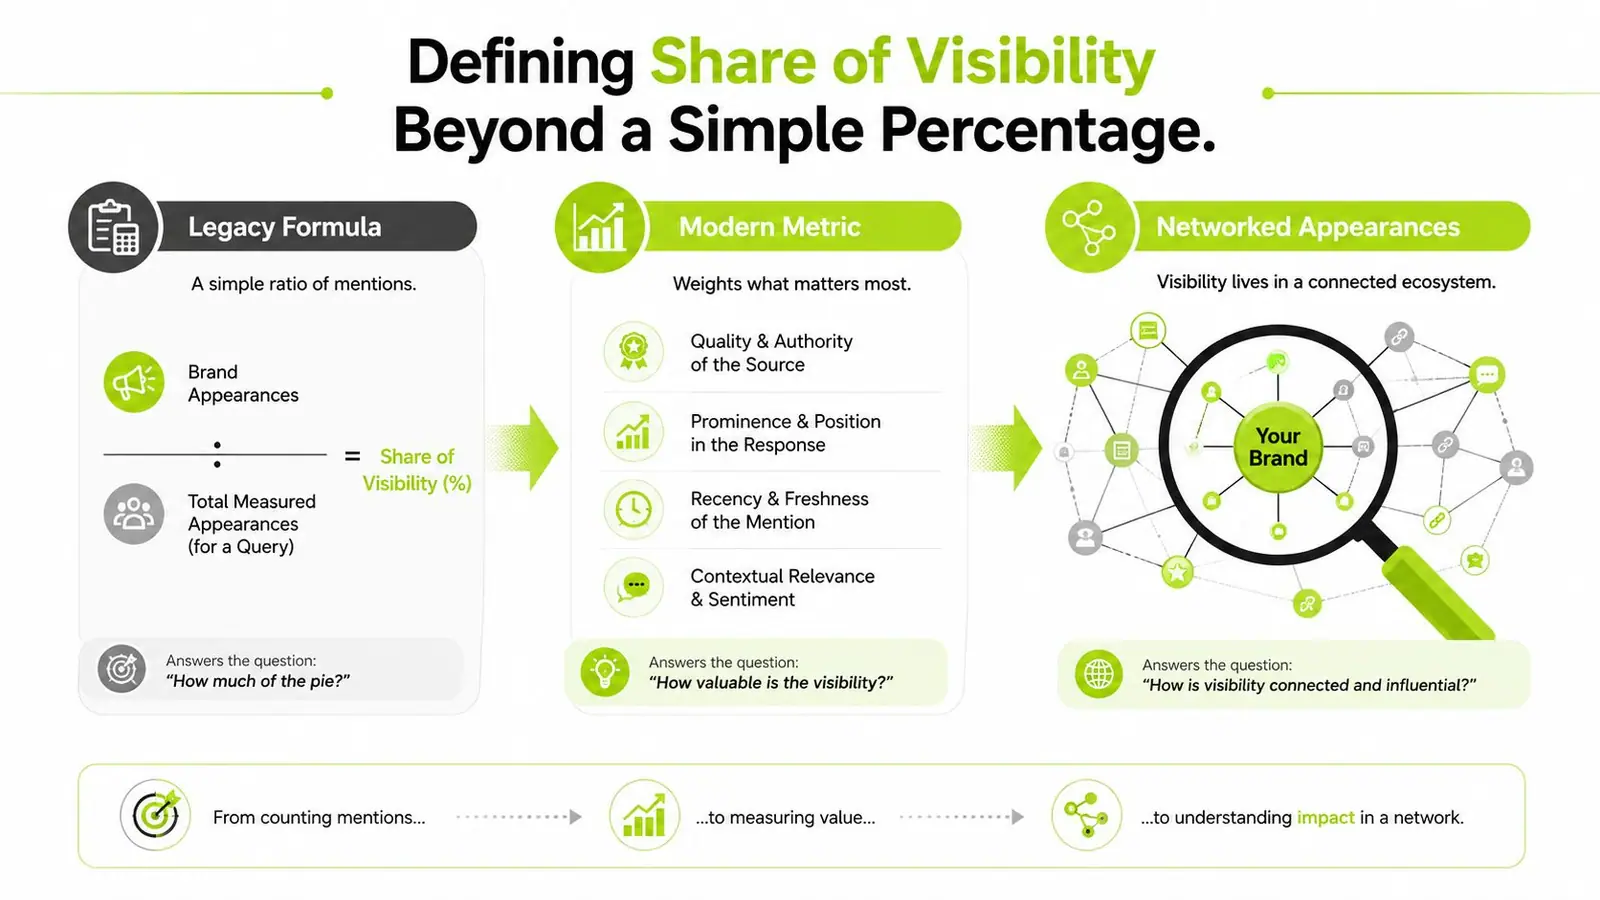
The simplest version starts with the familiar share-of-voice logic, where a brand's appearances are divided by total measured appearances in a query set. That's useful as a baseline, because it gives you a clean way to compare one brand against the category. But raw counts alone don't tell you how much attention those appearances receive.
Presence and attention are not the same thing
A result in position three and a citation inside an AI answer are not equal. One may get scrolled past, the other may be read as the answer itself. That's why share of visibility is better thought of as weighted attention, while traditional share of voice is mostly presence.
A practical way to model this is to assign weights by surface and prominence. For example, a cited AI Overview result might be weighted higher than a traditional organic listing, a featured snippet might sit in the middle, and a low organic result would carry much less attention weight. The exact weights vary by tool and team, and that's the point, there isn't a universal standard, so every vendor's number can look different even when they're looking at the same market.
AI citation share belongs in the same frame
The other piece is citation share across answer engines. If your domain appears in a prompt set across Perplexity, Gemini, and Claude, that's a different kind of visibility than a rank tracker can see. The measurement question becomes, how often does your domain appear among the cited sources returned for the same prompt set, and how much overlap exists between engines?
That overlap matters because it stops teams from treating one blended total like a universal truth. A brand can own a topic in search and still be underrepresented in AI citations, or the reverse. For a deeper look at how vendors frame this kind of reporting, AI visibility score explained is a useful reference point.
How the Calculation Actually Works in Practice
A clean spreadsheet model is enough to get started. Take five competitors and forty tracked queries, then count how often each brand appears in the surfaces you're measuring. The classic formula is straightforward, weighted appearances divided by total weighted appearances, multiplied by 100.
A worked example you can replicate
If your brand earns a total weighted appearance count of 246 out of 1,000 weighted appearances in the dataset, your share of visibility is 24.6%. That figure is easy to explain, but it still depends on the weight scheme you chose. If you change the weight rules, the answer changes too, which is why two teams can look at the same category and report different totals.
A more advanced version applies a position or citation-attention proxy before aggregation. In Google surfaces, that usually means a fitted CTR-style curve that gives more credit to the placements users see. In AI engines, it means a citation-position score that rewards being surfaced in the response itself rather than buried in a long source list.
| Share of Visibility: Three Calculation Approaches Compared | Formula | Example Result | Best Used For |
|---|---|---|---|
| Classic share of voice | Brand appearances ÷ total appearances × 100 | 24.6% | Quick category baseline |
| SERP-weighted visibility | Weighted appearances by position and surface ÷ total weighted appearances × 100 | Varies by layout | Comparing attention across Google result types |
| AI citation share | Prompts where your domain is cited ÷ total prompts answered × 100 | Varies by engine | Tracking presence in Perplexity, Claude, and Gemini |
For teams that want to benchmark the math inside a broader SEO stack, visibility score SEO is a helpful internal primer.
Build it as a composite, not a snapshot
Once you stack traditional organic share, SERP-weighted share, and AI citation share, the number behaves more like a moving average than a point estimate. That's useful because visibility doesn't move in a straight line. It shifts by query class, engine, and freshness, so the composite tells a better story than any single surface on its own.
Treat the metric like a weighted portfolio. One channel can dip while another rises, and the client only needs the overall shape if you've already explained the pieces.
Where Search and AI Engines Quietly Disagree
The fastest way to confuse a stakeholder is to say “we're visible across search and AI” without naming which engine you mean. Google, Perplexity, Claude, and Gemini don't share the same source pool, and they don't resolve relevance the same way either. That's why platform-specific share is more useful than a single blended average.
The overlap is partial, not complete
In a shared 50-query commercial-intent sample, the platform pairs below behaved differently enough to change the story of visibility. Google and Perplexity showed moderate URL overlap, Claude and Gemini overlapped more closely, and the four engines only lined up on the same brand a little over a fifth of the time. That means one brand can look strong in one surface and ordinary in another, even when the query intent is identical.
| Citation Overlap Across Search and AI Engines (50-query sample) | URL Overlap % | Brand Mention Overlap % |
|---|---|---|
| Google and Perplexity | Moderate overlap | Lower overlap |
| Claude and Gemini | Higher overlap | Higher overlap |
| All four engines | Partial agreement | About 22% brand agreement |
Different engines reward different source types
Google is still a ranked result environment. Perplexity leans harder on retrieval-style snippets and cited pages. Gemini blends grounded sources with entity-level understanding, while Claude's web citations reflect yet another retrieval pattern. If you're reporting one total share of visibility across all four, you're averaging systems that don't behave like one market.
That's why a “loss” in one engine may not be a loss at all, just a shift in source composition. A content page can fall out of one answer engine because the engine prefers fresher or more conversational sources, while still holding in Google. For teams using SEO and GEO strategies for better results, the advantage comes from separating organic search from generative retrieval instead of blending them too early.
For a broader explanation of the interface shift itself, search generative experience is worth reading alongside this metric.
Share of Visibility as a Leading Indicator of Market Movement
Visibility usually moves before revenue does. That's because branded search demand and citation presence catch intent early, before the clickstream and pipeline reporting fully catch up. In other words, share of visibility is often the first readable signal that a brand is gaining or losing category momentum.
Search demand follows visibility, then market catches up
The practical reason teams watch this metric is that branded query volume often rises after a visibility gain, not before it. When a brand gets pulled into more answers, more users remember it, search for it later, and eventually convert. Market share tends to lag that movement, so the leading signal is usually in the visibility line.
This is also where AI citations can compress the timeline. A strong mention in a cited Perplexity answer can create downstream branded demand faster than a lower-friction organic result, because the answer itself does part of the persuasion work. That doesn't make citations magic, it just means they can shorten the path from attention to curiosity.
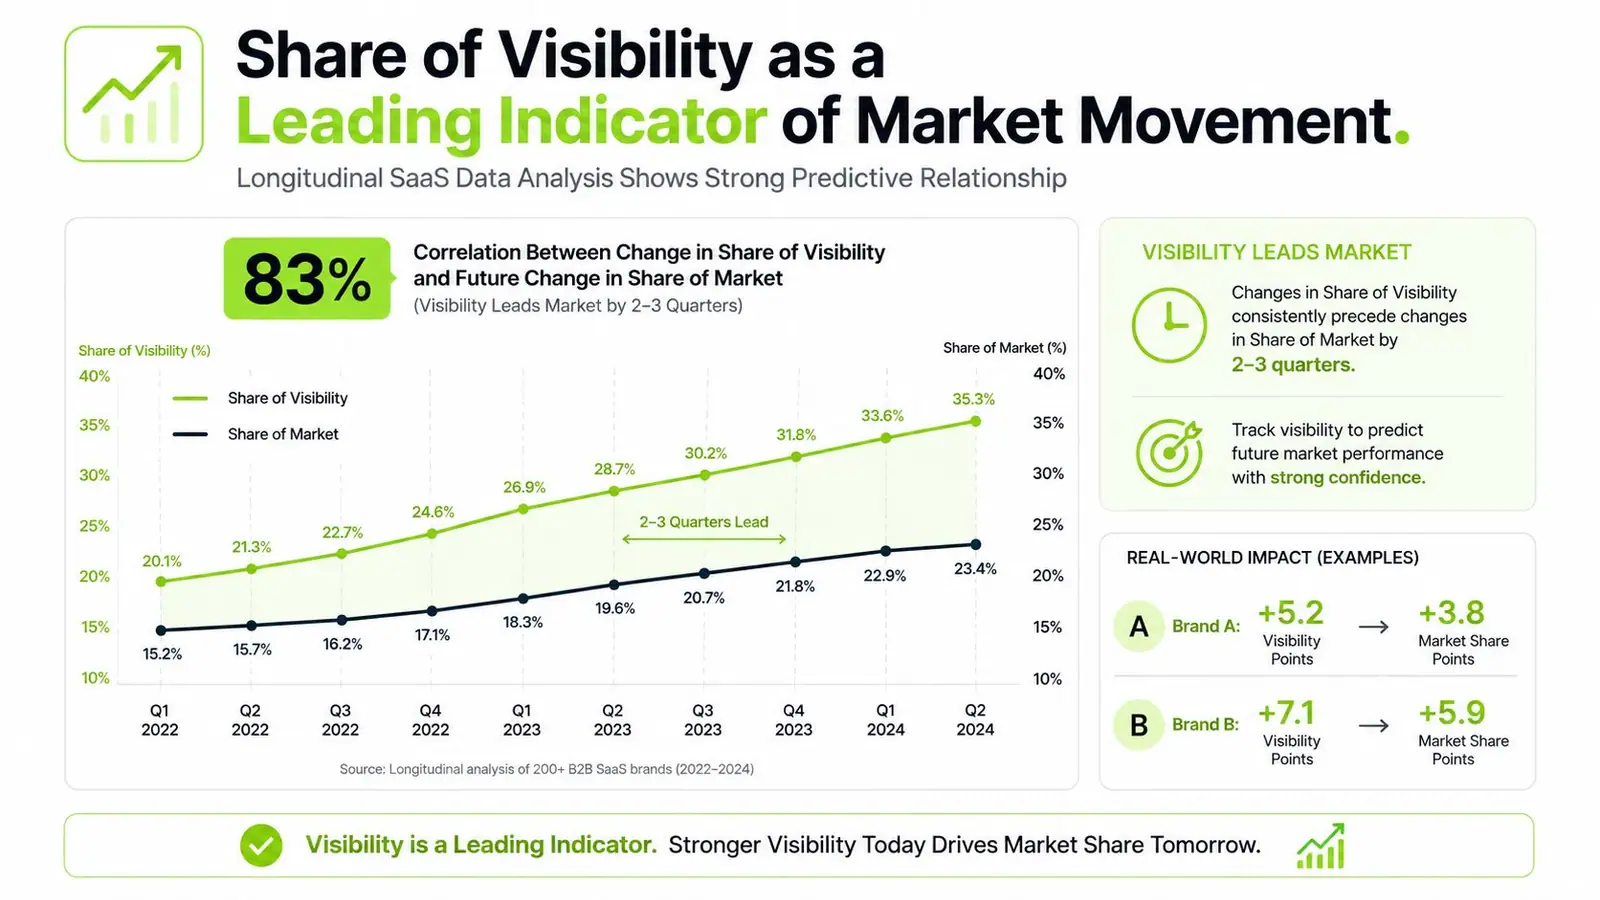
The reason the metric is useful is not that it predicts everything. It's that it gives teams an earlier read than revenue dashboards, especially when a category is shifting fast. For the search-side framing, share of search helps connect the dots between brand demand and eventual market movement.
Read it as a trend, not a trophy
A single month is rarely enough to tell whether a move is real. You need a line, not a snapshot, because the point is to see whether gains in visibility persist long enough to matter. If they do, you'll usually see branded demand move before market share does.
Benchmarking Methods That Hold Up to Client Questions
If a client challenges the metric, the benchmark has to survive scrutiny. That means sampling a broad enough query set, tracking multiple engines on a regular cadence, and documenting how you decide whether a brand counts as visible. It also means separating direct competitors from citation competitors, because the people who win the source layer are not always the same brands that sell the same product.
A defensible setup looks like this
Start with 200 to 500 queries per topic cluster. Include head terms, comparison queries, and long-tail prompts that reflect how people ask in search and AI interfaces. Run the set weekly across Google, Perplexity, Claude, and Gemini, then segment the results by intent so a high-intent comparison query doesn't get buried inside a broad informational bucket.
You'll also want a baseline period long enough to smooth normal volatility. A 12-week baseline gives you a cleaner before-and-after view than a single month does, especially when answer engines are rotating sources quickly. From there, define a recall threshold so you know when a mention counts as meaningful visibility instead of noise.
If the team can't explain why a domain counted as visible, the metric isn't ready for client reporting.
The competitive set should have three layers, direct product competitors, content competitors, and citation competitors. That third group matters most in AI search, because a publisher, review site, or neutral listicle can dominate the answer space without selling anything at all. For teams building this kind of reporting workflow, Surnex is one option that tracks visibility across Google AI Overviews, ChatGPT-driven discovery, Claude, and Perplexity while also tying the surface data back to SEO metrics.
What to put in the monthly client pack
Use a short checklist instead of a raw dump.
- Query mix: show how many head, comparison, and long-tail terms are in scope.
- Platform view: report Google, Perplexity, Claude, and Gemini separately before the composite.
- Visibility threshold: note the recall rule that qualifies a mention as visible.
- Competitor set: list product, content, and citation competitors together.
- Baseline comparison: show current performance against the 12-week average.
The Freshness Trap Most Reports Miss
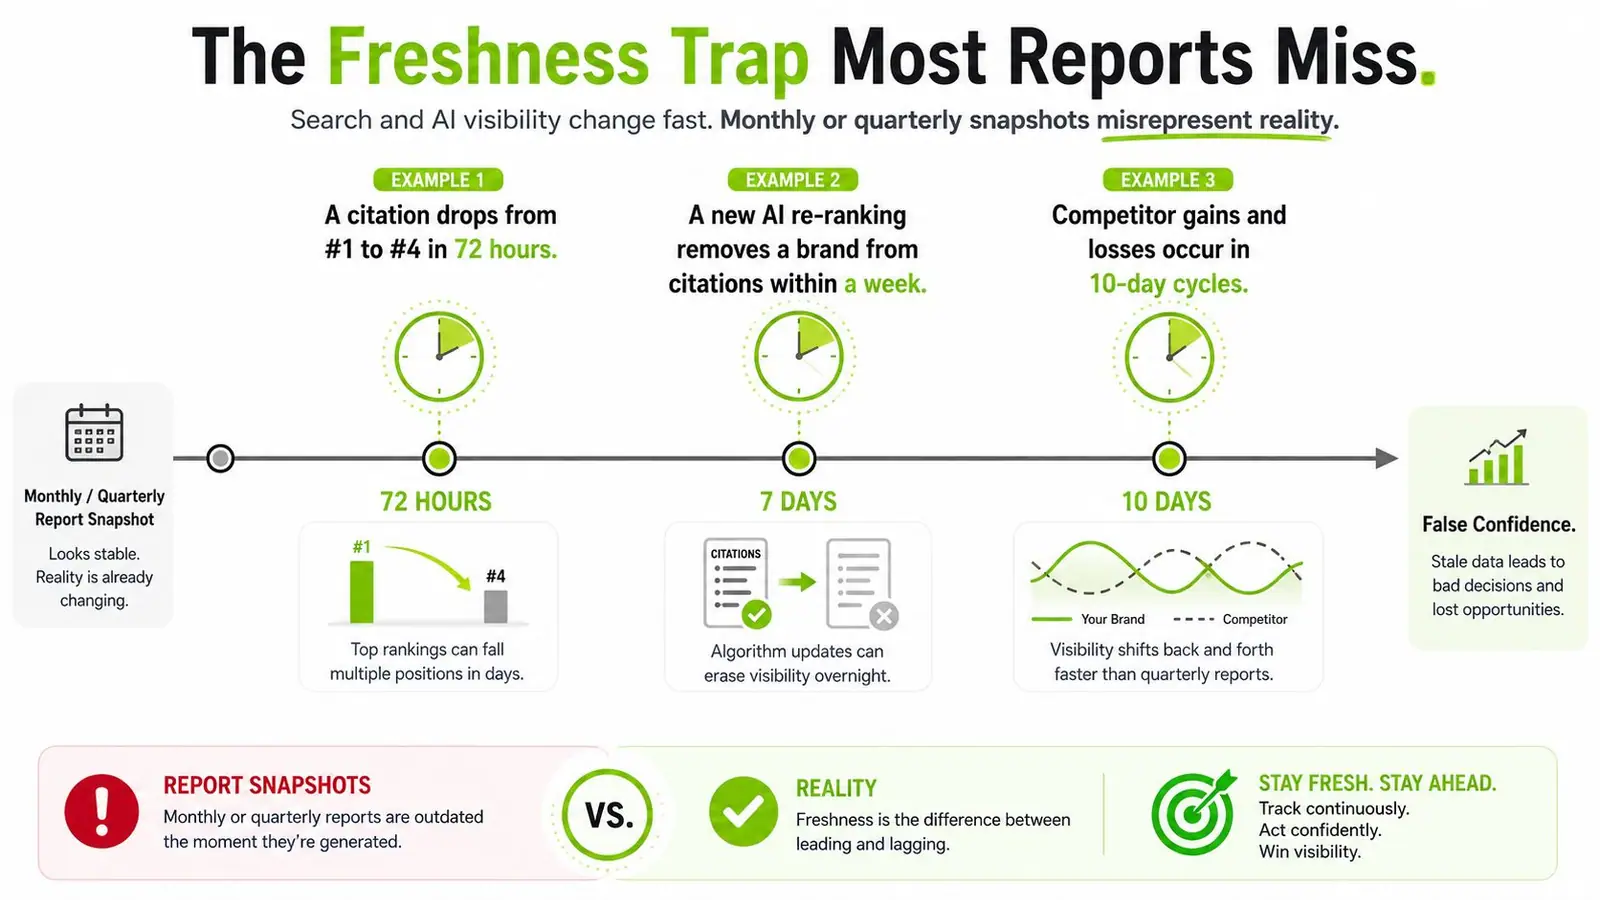
Monthly and quarterly reports make visibility look calmer than it really is. AI-driven systems can swap sources fast enough that a brand looks stable on paper while losing citation share in the background. If you only inspect the endpoint, you miss the slope.
Freshness changes the answer set
A source that appears early in the week can be replaced a few days later when a newer page enters the retrieval pool. That's especially visible in product-comparison queries, where fresher reviews or updated listicles can jump ahead of older incumbents. Publisher update cadences can also create a cycle, where visibility rises after refreshes and fades once the newer material ages.
Google behaves more slowly in many cases, so a strong organic position can hold longer unless the broader ranking system shifts. AI answer systems are less predictable on that front, which is why monthly rollups can hide the actual movement. Weekly tracking by query class is much more trustworthy if you need to see what's happening in real time.
Timestamp everything
Each row in the report should carry a timestamp and a decay note. That lets you see whether a drop came from content age, source replacement, or a genuine ranking loss. Without that layer, you end up arguing about the number instead of the cause.
Turning Visibility Data Into Actionable Priorities
A visibility report becomes useful when it changes what the team does on Monday morning. The easiest way to do that is to group findings into a small set of response buckets, then tie each bucket to a next step and a recovery window. That keeps the conversation focused on action instead of debating whether a chart is “good.”
Four buckets cover most cases
- Citation loss in AI answers: update structured data, strengthen Q&A format content, and earn more third-party mentions.
- Position drift in traditional SERPs: run a technical audit, deepen the content, and fix internal linking.
- Competitor gains in unbranded queries: do a gap analysis, then launch a content sprint around missing themes.
- Feature loss like sitelinks or image packs: review schema markup and optimize supporting assets.
A useful trigger is a 5-point share of visibility drop over two weeks in one query class. That gives the team a concrete threshold instead of a vague worry. From there, map actions into 30, 60, and 90-day windows so the client can see what changes fast and what needs a deeper rebuild.
| Share-of-Visibility Action Matrix | Root Cause | Tactical Response | Expected Recovery Window |
|---|---|---|---|
| Citation loss in AI answers | Fresh competitor sources or weak answer formatting | Update content, add schema, earn mentions | 30 to 90 days |
| SERP position drift | Technical or content depth issues | Audit, expand, interlink | 30 to 60 days |
| Competitor gain in unbranded terms | Content gap | Build new pages and comparison assets | 60 to 90 days |
| Feature loss | Missing markup or weak asset presentation | Fix schema and media optimization | 30 to 60 days |
For teams that already track content performance, content performance metrics gives the reporting layer a cleaner bridge from visibility to editorial decisions.
A strong QBR doesn't stop at the metric. It ranks actions by expected recovery versus production cost, so the client can see why one fix is first and another waits. That's the difference between reporting and strategy.
If you want a cleaner way to measure how your brand surfaces across Google and AI engines, Surnex tracks visibility, citations, and competitive share in one place. It helps agencies and in-house teams turn fragmented search signals into reporting they can defend, then use that same data to decide what to fix next.