Monday's reporting review starts with a familiar contradiction. The deck shows more impressions, rankings look stable, and the content calendar is full. Then a client asks the only question that matters: where are the qualified leads?
That question exposes the weakness in many content performance metrics dashboards. Teams still measure the funnel as if every discovery journey ends with an organic click, while buyers now encounter brands through AI answers, social platforms, video, communities, and zero-click search results. They are optimizing yesterday's funnel with tomorrow's traffic mix.
Why Content Performance Metrics Need a Reset in 2026
A weekly report can show stronger impressions, stable rankings, and growing sessions while qualified demand stays unchanged. That gap appears when teams treat visibility signals as the result instead of evidence for a larger business question.
Three forces now shape content measurement. AI Overviews can answer informational queries before a searcher reaches organic listings. Analysts reported organic CTR declines of roughly 34% to 61% when an AI Overview appears, with position-one clicks down by around 58% in some datasets. Their analysis also found that AI Overview citations from top-ten organic results fell from 76% in July 2025 to 38% in March 2026. A high ranking therefore provides incomplete evidence of AI visibility. See the 2026 content marketing statistics analysis for the reported findings.
Discovery now crosses search, video, communities, and answer engines. A buyer may watch a how-to video on YouTube, compare opinions on Reddit, encounter a short explanation on TikTok, then ask an LLM to summarize the available options. GA4 may capture only the final branded visit, leaving earlier preference-shaping interactions outside the standard attribution view.
Some journeys create no session at all. A brand can be cited, summarized, or mentioned in an AI answer without receiving a click. Rising impressions alongside flat pipeline indicate exposure without measurable influence. Attribution also needs a way to classify AI referrals, or that source of demand remains invisible.
Practical rule: If a metric cannot change an editorial, distribution, or commercial decision, remove it from the executive view.
The reset requires two distinct metric families: attention signals and business-progress signals. Teams should retain reach and ranking data for diagnosis, then connect them to qualified discovery, assisted conversion, and pipeline influence. Citation share, prompt coverage, and AI referral rate belong in the same operating model, with clear definitions and consistent reporting periods.
I use Narrareach's platform content benchmarks and formulas to check standard measurement mechanics. Formulas do not resolve fragmented discovery, so the reporting layer must combine classic SEO data with search marketing intelligence. APIs can feed both sets of signals into one dashboard, allowing teams to compare organic performance with AI-era visibility instead of maintaining separate vanity reports.
What Content Performance Metrics Actually Measure
Content performance metrics are quantified signals that connect a piece of content to an outcome. That outcome might be an engaged session, a completed form, an assisted conversion, a sales opportunity, or a citation inside an AI-generated answer.
This definition matters because a metric can be accurate and still be strategically useless. Pageviews count page loads. Follower totals count account connections. Likes count a narrow form of interaction. None of these signals proves that the audience was relevant, understood the content, trusted the brand, or moved closer to a commercial decision.
A useful KPI must pass three tests:
- Business connection: It relates to a stated objective, such as qualified discovery, lead creation, pipeline influence, or brand authority.
- Comparability: You can compare it across pages, content formats, query groups, and reporting periods without changing its meaning.
- Actionability: An editor, SEO lead, distribution manager, or revenue team can make a decision based on the result.
Consider a blog post with 50,000 pageviews. That number may look impressive, but the post deserves a low content performance score if engaged sessions are weak, readers stop before the key answer, and assisted conversions are absent. The traffic could come from broad queries that attract people with no buying intent, or from a title that promises more than the article delivers.
A better evaluation sequence
Start with the job the content is supposed to perform. An awareness article may prioritize qualified reach, brand mentions, and prompt coverage. A comparison page should emphasize engaged sessions, CTA clicks, conversion rate, and revenue contribution. A technical guide may succeed by earning citations and influencing later branded searches, even when immediate click volume is modest.
GA4 guidance for content-focused sites commonly treats 50% or higher engagement rate as a useful benchmark, while strong resource sites may exceed it. Average engaged time is often around 30 seconds and can rise above 1:30 for high-quality resource content, according to content measurement benchmarks. These are reference points, not universal targets. Intent, format, audience, and page purpose still determine the right interpretation.
The practical question isn't “How many people saw this?” It's “Did the right people interact with it in a way that supports the intended outcome?” The rest of the measurement stack should answer that question at each stage of discovery, attention, influence, and conversion. For a broader overview of content performance metrics 2026, use the same filter rather than copying a generic KPI list into a dashboard.
The Core KPI Categories Every Team Should Track
A workable content measurement system needs four operational buckets. Each bucket answers a different question, and none can replace the others.
| Category | Primary KPIs | What It Answers | Common Pitfall |
|---|---|---|---|
| Discovery | Organic impressions, average position, indexable coverage, query-set share of voice | Can the audience find the content? | Treating impressions or rankings as proof of demand |
| Engagement | Engaged sessions, engagement rate, scroll depth, engaged time, path completion | Does the content hold attention and create intent? | Rewarding time spent without checking whether users reached the next step |
| Conversion | Goal completions, assisted conversions, influenced pipeline, revenue attribution | Does content contribute to commercial outcomes? | Relying only on last-click conversions |
| Authority | Backlink velocity, referring-domain quality, branded search lift, unlinked mentions | Is the content earning trust that compounds? | Chasing link volume while ignoring relevance and conversion value |
Discovery shows whether the content is eligible to win
Search Console impressions can rise because a page appears for a broader set of queries. That doesn't necessarily mean the page is reaching valuable prospects. Split branded and non-branded queries, classify intent, and group terms by topic before interpreting movement. A stable average position can hide losses on commercial terms if informational queries expand the overall average.
Indexable coverage adds a technical check. If important URLs aren't indexed, content quality analysis won't fix the underlying discovery failure. Rank trackers can then add SERP feature presence and share of voice across a defined query set, which is more useful than a sitewide average.
Engagement reveals the quality of the match
Engaged sessions and engagement rate tell you whether visitors performed meaningful interactions. Scroll depth adds structure to that signal. Healthy engaged time with weak scroll depth may mean the page delays the answer or buries the useful material. Strong scroll depth with poor CTA CTR often indicates that the article informs readers but doesn't give them a convincing next action.
Interactive content can also change the engagement profile. A benchmark cited by HubSpot reports that interactive content outperforms static content by 52.6% in engagement, with buyers spending 13 minutes on interactive content versus 8.5 minutes on static content. Those figures appear in HubSpot's marketing statistics, and they should be treated as format guidance, not a promise that every interactive asset will outperform every article.
Conversion and authority complete the picture
A page may generate few direct conversions but assist several later journeys. GA4 attribution paths and CRM opportunity data help expose that contribution. Authority metrics work on a longer horizon. A relevant referring domain, a useful unlinked mention, or a rise in branded searches can support future discovery, but authority should never become a substitute for commercial validation.
Optimizing one bucket in isolation creates predictable damage. A team can increase impressions with broad topics, raise engagement by making pages entertaining, or collect links through highly shareable research while qualified leads decline. The operating unit is the full path from findability to trust to action.
How to Measure and Interpret Each Metric
Measure each KPI close to its native source, then reconcile the outputs before placing them in one report. GA4 should supply engaged sessions, engagement rate, events, and conversions. Its attribution paths report helps identify assisted interactions rather than forcing every result into a last-click model.
Google Search Console supplies query, page, impression, click, CTR, and average-position data. Use page and query filters together. A page-level report can show that clicks fell, while a query-intent split reveals that branded demand held steady and non-branded informational demand changed because the SERP layout changed.
Third-party rank trackers add information that Search Console doesn't organize as cleanly, including SERP feature presence, competitor visibility, and share of voice across a controlled keyword set. CRM or ecommerce systems remain the authority for opportunity stages, closed revenue, customer status, and commercial attribution.
| KPI | Primary Source | Report or API | Common Pitfall |
|---|---|---|---|
| Engaged sessions | GA4 | Data API and explorations | Treating every session as equal |
| Engagement rate | GA4 | Data API | Comparing pages with different intent |
| Conversions | GA4 and CRM | Events, attribution paths, opportunity reports | Counting a micro-event as revenue |
| Queries and clicks | Search Console | Performance report and API | Mixing branded and non-branded demand |
| Average position | Search Console and rank tracker | Query, page, and SERP reports | Ignoring AI Overviews and featured snippets |
| Share of voice | Rank tracker | Tracked query-set report | Changing the keyword set mid-period |
| Pipeline influence | CRM | Campaign and opportunity reports | Using only first or last touch |
| Revenue attribution | CRM or ecommerce platform | Opportunity and transaction reports | Assigning revenue without a documented model |
Reconciliation is part of measurement
GA4 sessions and Search Console clicks won't match, and they shouldn't be treated as interchangeable. Compare them using the same landing-page filters, date range, country, device, and search channel assumptions. Search Console records search-result interactions, while GA4 records sessions after a user reaches the site. Privacy controls, redirects, consent behavior, and tracking failures can widen the gap.
Annotate every chart with query intent and SERP context. A position-one CTR baseline from an ordinary result shouldn't be applied to a query that triggers an AI Overview, featured snippet, video carousel, or local pack. Without those annotations, the team may “fix” a title tag when the change occurred above the organic listings.
Video needs the same discipline. A view is useful for distribution analysis, but it doesn't prove that a viewer retained the message or took a commercial step. Teams evaluating video economics can use the practical framework in find your video ROI with Klap, then connect video-assisted behavior to the same conversion and revenue model used for written content.
AI Visibility and Citation Metrics You Cannot Ignore
A page can hold a strong organic position while an AI-generated answer shapes the buying decision first. Google AI Overviews, ChatGPT, Perplexity, and other assistants summarize topics, recommend brands, and cite sources before a user reaches a website. Rankings and CTR alone cannot show whether your content supplied that answer.
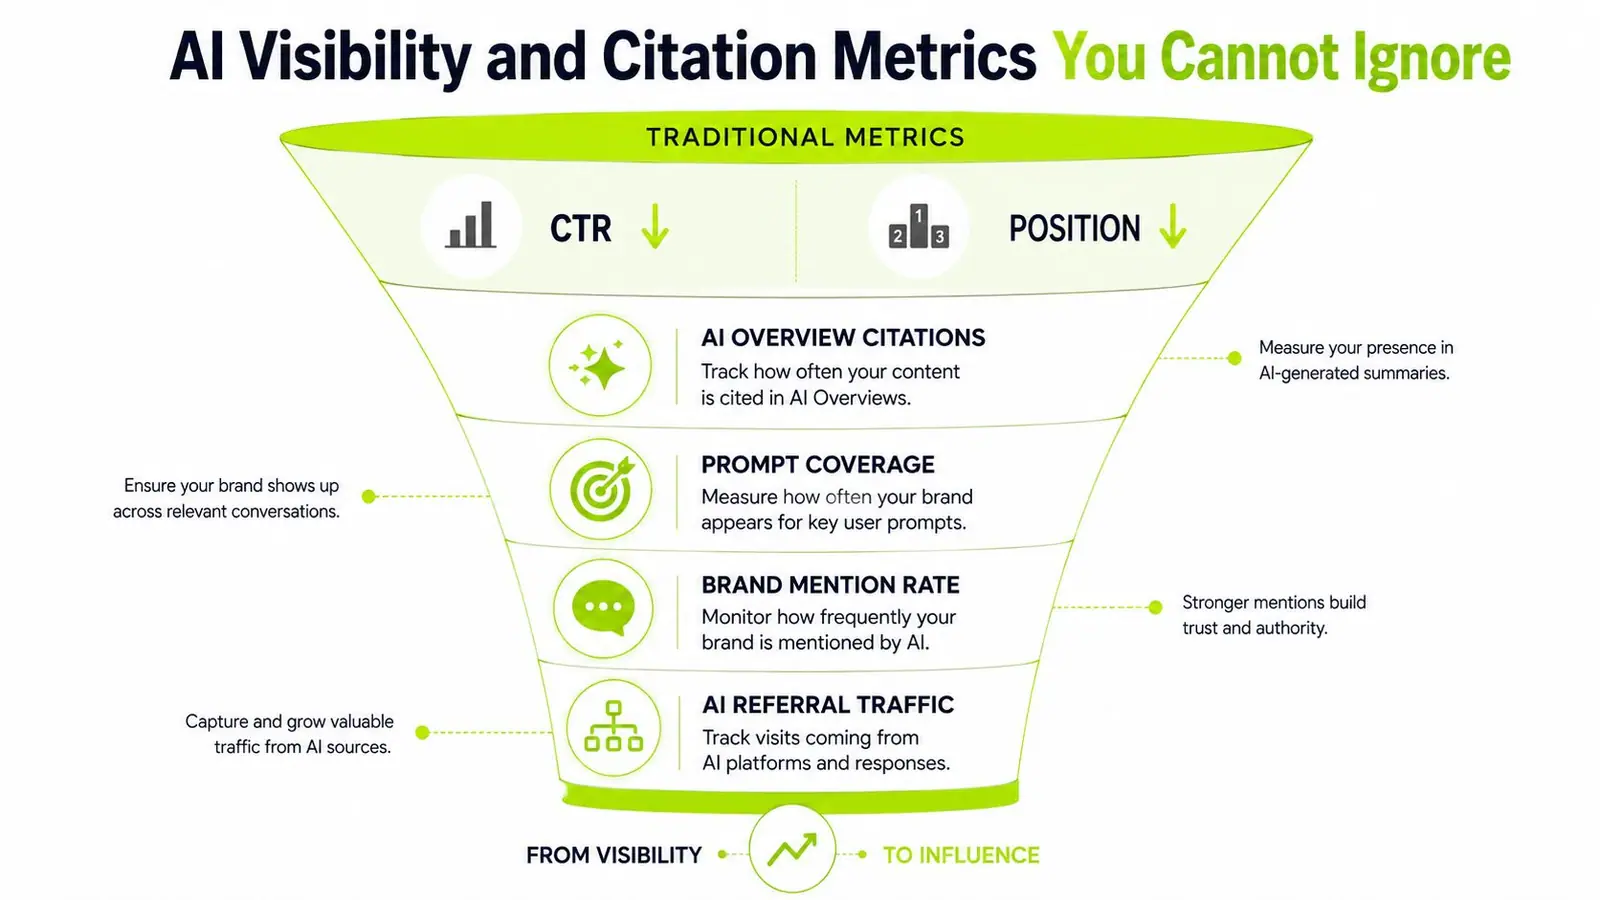
Track four metrics beside traditional SEO KPIs:
- Citation share: The proportion of tracked AI answers that cite your domain. Record the prompt, surface, cited URL, cited passage, competitors shown, and date.
- Prompt coverage: The proportion of tracked prompts that mention your brand or return a relevant association. It measures breadth, while citation share measures source-level presence.
- Brand mention rate: How often your brand appears in AI answers, whether or not the answer links to your site. Review wording and context, not only the count.
- AI referral rate: The share of owned-site sessions arriving from identifiable chat or AI surfaces. It captures measurable traffic, but many AI journeys remain clickless.
Build a prompt library that reflects demand
Use customer language from sales calls, support tickets, internal site search, Search Console queries, comparison pages, and product categories. Include informational, problem-aware, comparison, alternative, and branded prompts. Keep the set stable for period comparisons, then revise it when product positioning or market language changes.
Run the same prompts on a defined schedule through available APIs or controlled collection workflows. Surnex, Otterly, Profound, and custom GPT or Perplexity wrappers can record citations, mentions, answer text, and competitor presence. Store raw responses. The cited passage often explains performance better than a presence flag.
Connect AI visibility results with Search Console data at the query or topic level. A click decline deserves less concern when citation share and branded search activity rise. It requires closer investigation when citations disappear, prompt coverage contracts, and qualified conversions fall together. Interpret the combined movement rather than one declining CTR line.
The reporting gap remains substantial. Many marketing teams still track traditional outcomes without adding AI-specific KPIs, which leaves them unprepared to explain changes in organic clicks, brand demand, or assisted conversions.
For practical context on how AI answers affect search behavior, review Google AI Overviews and SEO. Content can create value by shaping an answer, earning a citation, or generating brand preference even when the user never clicks. A unified reporting layer should place these signals beside rankings, traffic, conversions, and revenue so the team can distinguish visibility from influence.
Dashboards, APIs, and Reporting Workflows
A reliable reporting layer has three levels. The bottom level collects raw data. Connect the GA4 Data API, Google Search Console API, rank trackers, CRM, ecommerce platform, and AI visibility tools to a warehouse such as BigQuery, Snowflake, or a lightweight PostgreSQL and dbt setup.
The warehouse matters because definitions drift when every client report uses a different spreadsheet formula. Store the source, extraction time, dimensions, filters, and calculation logic. Keep raw data separate from modeled tables so a revised definition doesn't destroy the historical record.
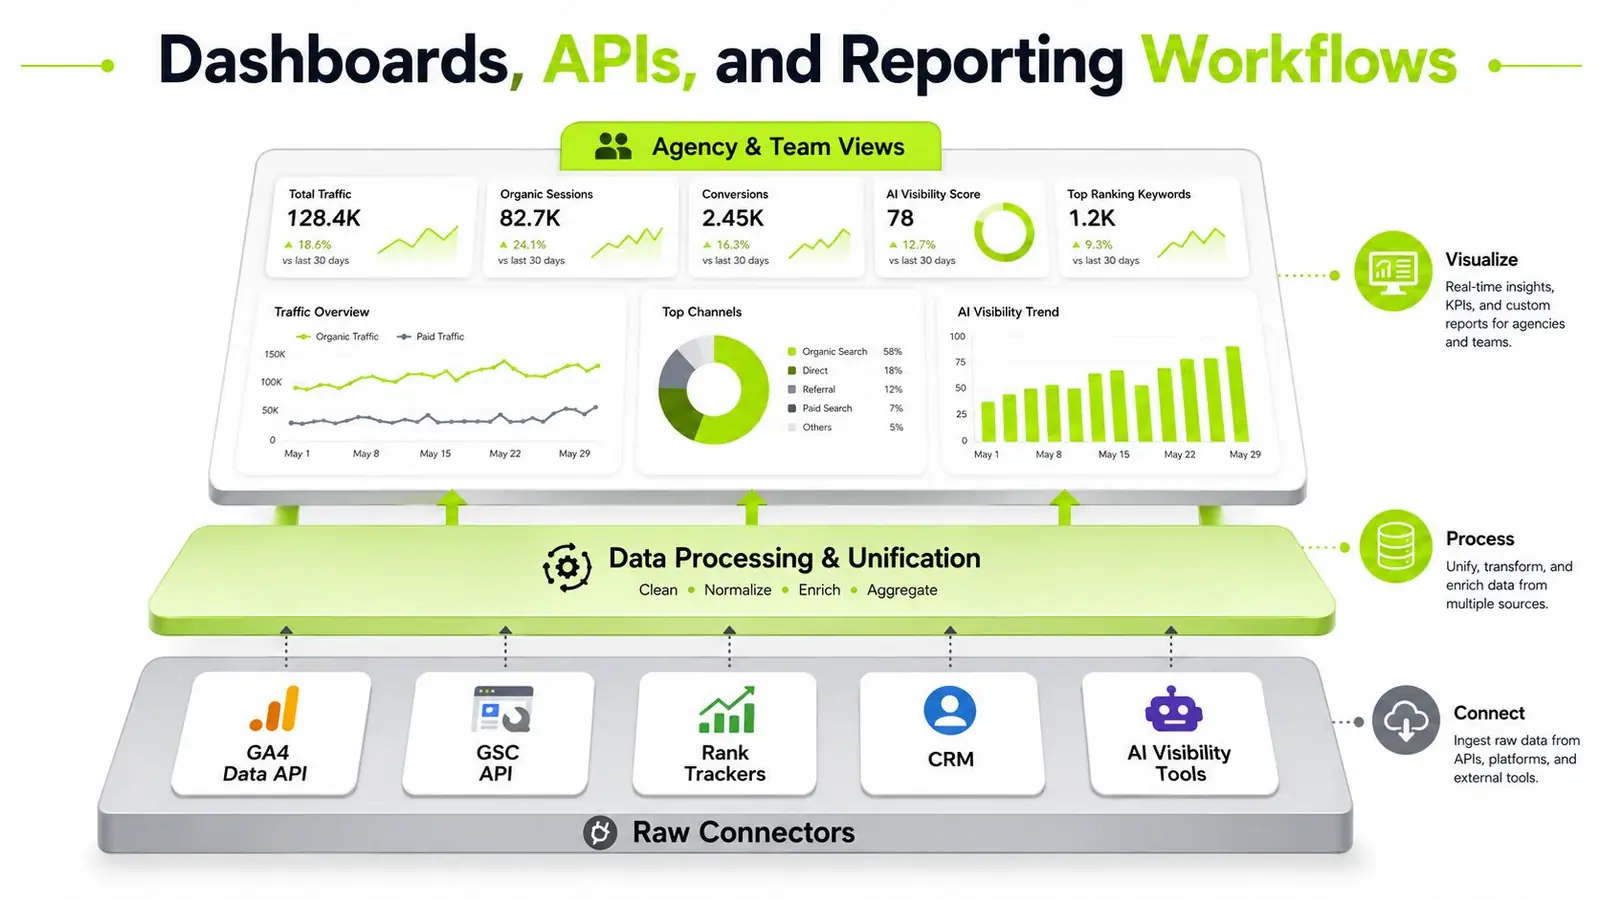
The middle level is the semantic model. Define engagement rate, assisted conversion, citation share, prompt coverage, AI referral rate, and revenue attribution once. Add dimensions for page, content cluster, format, funnel stage, query intent, country, device, SERP feature, and AI surface.
The top level is the decision layer. Looker Studio, Metabase, and Power BI can present the same modeled data to different audiences without changing the underlying calculations.
Separate operating views by audience
An SEO manager needs query movement, indexation, rankings, SERP features, citation gaps, and technical alerts. A content lead needs engagement quality, scroll behavior, CTA performance, content decay, and update priorities. An executive needs qualified conversions, influenced pipeline, revenue attribution, and a concise explanation of what changed.
A useful cadence keeps those views from competing:
- Daily: Check rank movement, major technical anomalies, and AI citation changes.
- Weekly: Review content and query groups, investigate outliers, and assign actions.
- Monthly: Publish a narrative report that explains causes, trade-offs, and decisions.
- Quarterly: Recalibrate benchmarks, query sets, attribution assumptions, and KPI definitions.
Automation isn't automatically better. Use APIs when account volume, reporting frequency, or data complexity makes manual work error-prone. Manual exports remain reasonable for a small, stable dataset that rarely changes. Automate the collection first, then validation, then visualization. A beautiful dashboard built on inconsistent inputs only makes bad decisions faster.
The automate SEO reporting workflow offers useful context for deciding which recurring tasks should leave the spreadsheet. Keep a human review step for prompt quality, intent classification, anomaly interpretation, and recommendations. Those decisions still require judgment.
Benchmarking, Pitfalls, and Optimization Priorities
Benchmarking should answer whether performance is improving for this business, against relevant peers, and within the channel context. Use three layers: your own historical baseline, category or competitor comparisons, and channel-specific benchmarks. Don't treat an external benchmark as a target without checking intent mix, business model, content maturity, tracking quality, and SERP conditions.
The measurement environment creates several traps:
- Chat-driven pageview inflation: Referral classification can place some AI or chat traffic into broad buckets, obscuring the actual source.
- AI Overview CTR decline: Fewer clicks may reflect answer absorption rather than weaker content.
- GA4 and Search Console duplication: Search Console clicks and GA4 sessions represent different stages and shouldn't be added together.
- Seasonality distortion: A quarter-over-quarter decline may be normal demand movement, while a year-over-year comparison can hide a recent technical issue.
- Conversion fear: Teams sometimes remove important conversion actions from reports because low counts look uncomfortable. That hides the signal instead of improving the funnel.
Read the mix before judging the page
“Traffic up, conversions flat” usually deserves a query-mix investigation before a rewrite. Check whether growth came from broader informational terms, a new country, branded searches, or a different SERP type. If qualified discovery is down while total sessions rise, the content may be attracting the wrong audience rather than failing at persuasion.
Time-based metrics need behavioral partners. If engaged time is healthy but scroll depth is low, the page may delay value or bury the answer. If scroll depth is high but conversions stay weak, the content may be useful but commercially passive. Guidance on measuring content performance treats scroll depth, CTA CTR, and conversion rate as complementary diagnostics because they isolate attention, intent progression, and outcome.
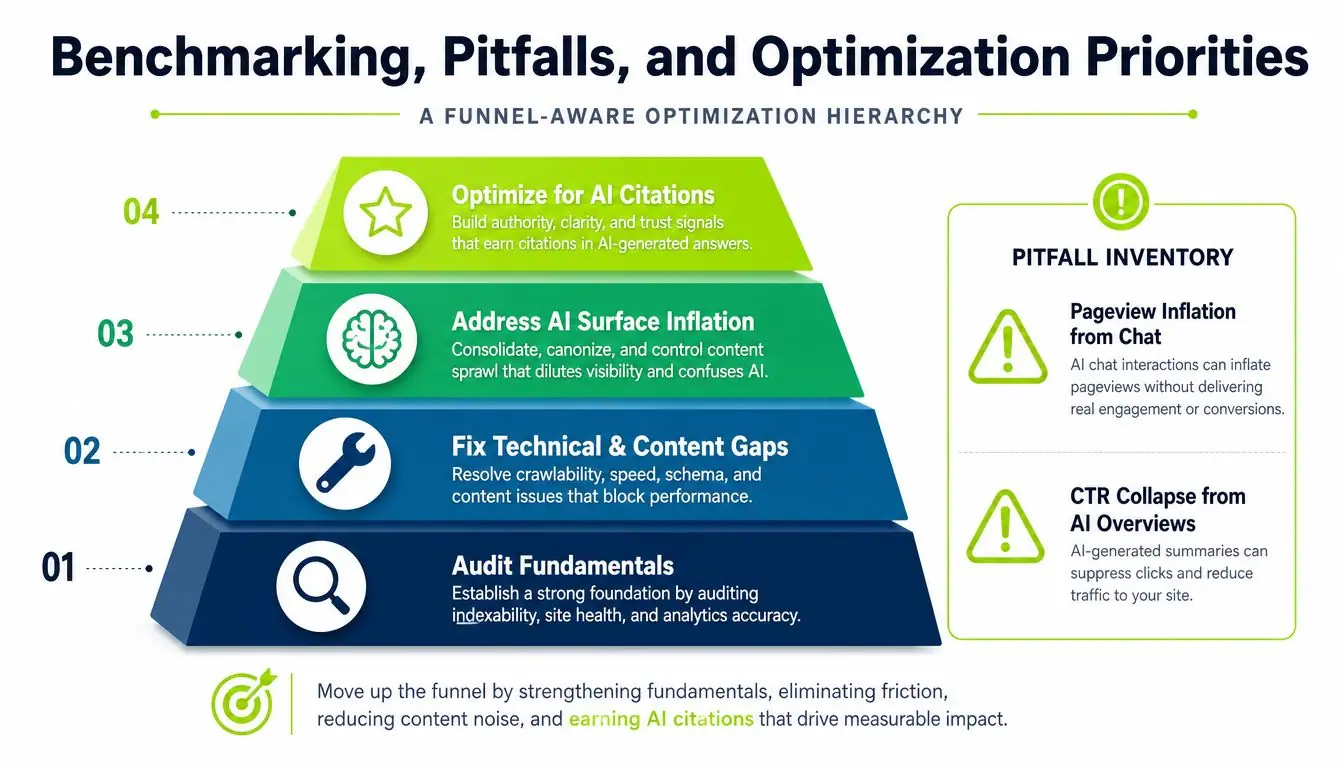
My prioritization rule is simple:
- Fix measurement integrity: Confirm event definitions, source classification, landing-page joins, attribution rules, and query segmentation.
- Repair authority decay: Address lost links, weak referring domains, outdated citations, and unlinked mentions.
- Remove conversion friction: Improve CTAs, forms, internal paths, offer relevance, and handoff to sales.
- Improve engagement quality: Strengthen introductions, answer placement, structure, media, and intent alignment.
- Expand AI visibility: Increase prompt coverage, citation share, brand mention rate, and AI referral quality through evidence-led content.
This order prevents vanity-dashboard culture from directing the budget. It also keeps AI metrics in their proper place. Citation share matters, but not if the tracked prompts are irrelevant. AI referral rate matters, but not if those visits never become qualified actions. Authority matters, but not if the page fails to answer the user clearly.
For a repeatable comparison model across markets and competitors, the industry benchmarking framework can help structure the baseline. The operating principle is consistent across agency retainers and in-house sprints: validate the measurement, diagnose the funnel, then optimize the stage that limits business progress.
Surnex brings traditional SEO reporting and AI search visibility into one working layer, including rankings, content opportunities, citations, and brand presence across emerging AI experiences. Visit Surnex to connect performance data with citation gaps and build reporting that shows influence, not just clicks.