Teams often still wait for sales reports, brand trackers, or quarterly market share updates to tell them what already happened. That's a problem. By the time those numbers move, the underlying shift in demand has usually been building for weeks or months.
A stronger question is this: what can you watch now that tells you where demand is likely heading next?
That's where share of search earns its place on the dashboard. Instead of measuring what your company spent, published, or ranked for, it looks at what people actively seek out. When more people search for your brand relative to competitors in the same category, you're seeing a change in attention and intent before many downstream business metrics catch up.
This is why the metric matters beyond SEO. It gives brand, performance, PR, and product marketing teams a common signal. If branded demand rises after a launch, campaign, or burst of press, the movement shows up in search behavior. If a competitor starts gaining mental availability in the market, search often reflects that before finance does.
The timing also matters more now than it did a few years ago. Traditional search is still central, but discovery no longer ends on a list of blue links. Google has added AI Overviews and AI Mode. Buyers also ask questions in chatbots and discovery tools that summarize options instead of sending clean referral traffic. In that environment, traffic alone is a weaker proxy for brand strength. Demand signals matter more.
Introduction
How do you tell whether brand demand is rising before revenue reports, attribution models, or market share decks catch up?
Share of search is one of the few metrics that gives a usable answer. It tracks branded demand in a way marketing teams can monitor weekly, sometimes daily, using sources they already have access to, such as Google Trends and search volume tools. The number is never perfectly clean. Brand names overlap with common words, product lines blur the category, and international markets introduce language and geography problems fast.
That messiness does not make the metric weak. It makes setup matter.
Used well, share of search helps a team spot whether brand interest is expanding, stalling, or slipping against a defined competitor set. It also adds context that traffic metrics often miss. A jump in sessions can come from rankings, paid support, or a single piece of content. Branded search demand is harder to fake and usually more useful when the goal is to understand market pull.
The metric has become more valuable as search behavior fragments across surfaces. Google still matters, but discovery now happens inside AI Overviews, AI Mode, retailer search, YouTube, and LLM chatbots that summarize brands without sending a click. That changes the job for SEO. Measuring visibility is no longer only about rankings and visits. Teams need a way to track whether people ask for the brand directly, and whether AI systems mention it when buyers research the category.
Share of search gives you the starting point for that work. Traditional measurement still relies on branded query data, but the modern version has to connect search demand with brand presence in AI-generated answers. That is one reason it pairs well with broader visibility frameworks such as share of voice in SEO. One tells you how much demand you capture by name. The other helps explain how visible you are across the topics that create that demand in the first place.
In practice, good reporting comes from consistency, not perfection. Define the competitor set carefully. Decide how you will handle misspellings, product terms, and ambiguous queries. Keep the method stable long enough to trust the trend. That is the standard that makes share of search useful in real marketing decisions.
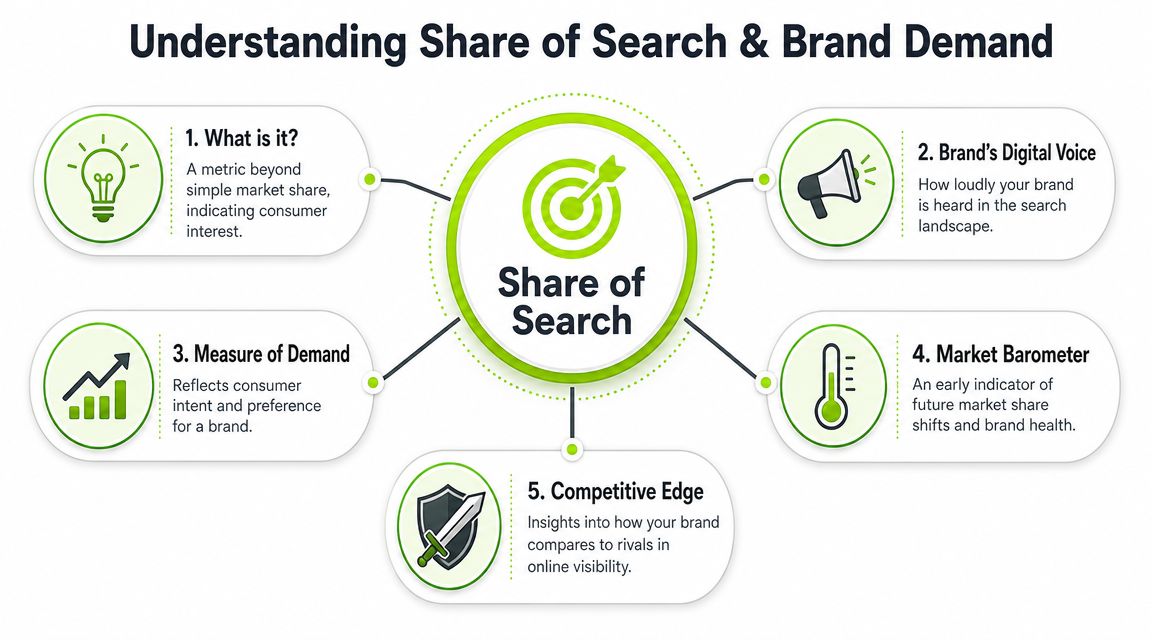
Understanding Share of Search and Brand Demand
How much of your category's branded demand belongs to you?
That is the practical question behind share of search. The metric looks at branded search interest for your company compared with the branded search interest captured by competitors. In plain terms, it shows how often buyers ask for your brand by name, relative to the rest of the market you track.
It does not capture every brand impression or every sales signal. It captures expressed demand. That distinction matters because branded searches usually indicate memory, consideration, or intent that already exists before the click.
What the metric actually measures
At its simplest, share of search is your branded search volume divided by the total branded search volume for the competitor set you chose. Teams usually pull that from Google Trends for directional comparisons, then sanity-check it against search volume tools such as Google Ads Keyword Planner, Ahrefs, Semrush, or Similarweb.
The formula is simple. The setup is not.
Brand names are messy. Searchers misspell them. They add product names, locations, and review modifiers. Some brands are broad dictionary words. Others have parent-brand and sub-brand demand split across multiple query patterns. A clean spreadsheet can hide a weak method, so the essential work is in query selection and consistent rules.
That is why I treat share of search as a measurement discipline, not a single number. If the competitor list keeps changing, or one team includes product-line searches while another strips them out, the trend stops being useful. Stable methodology beats false precision.
The metric also has a newer job now. Search demand still starts the analysis, but modern SEO teams should compare that demand with how often the brand appears in AI-generated discovery. If branded search is rising while AI Overviews and chatbot answers rarely cite your brand in category prompts, demand exists but machine-mediated visibility is lagging. That gap is becoming more important as buyers research without clicking.
Share of search versus share of voice
Teams often blur share of search and share of voice because both are competitive visibility metrics. They answer different questions.
- Share of voice measures how visible your brand is across channels such as paid media, PR, organic rankings, or category coverage.
- Share of search measures how often people actively look for your brand compared with named competitors.
One reflects market exposure. The other reflects market pull.
That difference shows up in reporting all the time. A paid burst can lift impressions, branded SERP ownership, and topic visibility for a month. If branded query demand does not move afterward, the campaign probably bought attention without building memory. If share of search rises later, the activity may have changed how buyers think, not just what they saw.
For SEO teams, the best read usually comes from pairing share of search with a broader view of share of voice in SEO. One metric helps explain how visible you are across category topics. The other shows whether that visibility turns into branded demand.
This matters beyond search reporting. Teams trying to boost LTV and ROAS need to know whether acquisition activity is creating customers who remember the brand enough to seek it out again, not just click once from an ad.
A campaign can win reach and still lose recall. Share of search makes that visible.
Why Share of Search Is Your Most Important Predictive KPI
The strongest argument for share of search isn't that it sounds strategic. It's that it helps teams make earlier decisions.
When marketers treat the metric properly, they stop asking only, “Did this campaign drive immediate conversions?” They also ask, “Did it increase the rate at which buyers seek our brand out versus competitors?” That second question is often closer to long-term business impact.
Why leadership teams should care
Kantar notes that practitioners often compute rolling 12-month averages to smooth volatility, and that normalized share of search correlates with brand salience, sales, and future market share in validation work. That's why it functions as a reliable leading indicator for planning when used carefully in Kantar's explanation of share of search.
A predictive KPI earns attention when it changes how teams allocate effort. Share of search can do that in several ways:
| Use case | What the metric helps you see |
|---|---|
| Brand tracking | Whether awareness is rising or slipping against named competitors |
| Campaign review | Whether PR, launches, or paid bursts increased branded demand |
| Competitive intelligence | Which rival is gaining attention before later reports confirm it |
| Executive reporting | A simpler market-facing signal than channel-specific SEO metrics |
What works in practice
The teams that get value from share of search usually do three things well:
- They compare the right competitors. Not every company in the industry belongs in the same tracking set.
- They use trend lines, not isolated months. One spike can come from news, controversy, or seasonality.
- They interpret changes with context. Search demand rises for many reasons, and not all of them are good.
That last point matters. A brand recall event, product issue, or public controversy can increase branded search. The metric is powerful, but it still needs interpretation.
Leadership takeaway: Don't put share of search on a dashboard by itself. Pair it with campaign timelines, PR events, product launches, and market notes.
Why it belongs next to revenue metrics
A good marketing dashboard should connect leading indicators with lagging outcomes. Revenue and pipeline show result. Share of search shows momentum.
That's also why predictive planning matters beyond SEO. If your ecommerce team is trying to boost LTV and ROAS, they need earlier demand signals, not just post-purchase analysis. Share of search won't replace revenue data, but it can improve the timing of decisions that affect it.
Used well, the metric helps teams defend investment before the payoff is fully visible. That's a practical advantage, especially in budget reviews where waiting for certainty usually means reacting too late.
How to Calculate Share of Search Accurately
Most of the confusion around share of search comes from one mistake: teams assume there's one universal formula and one clean dataset. There isn't. The core calculation is simple. The hard part is getting inputs that are consistent enough to compare over time.
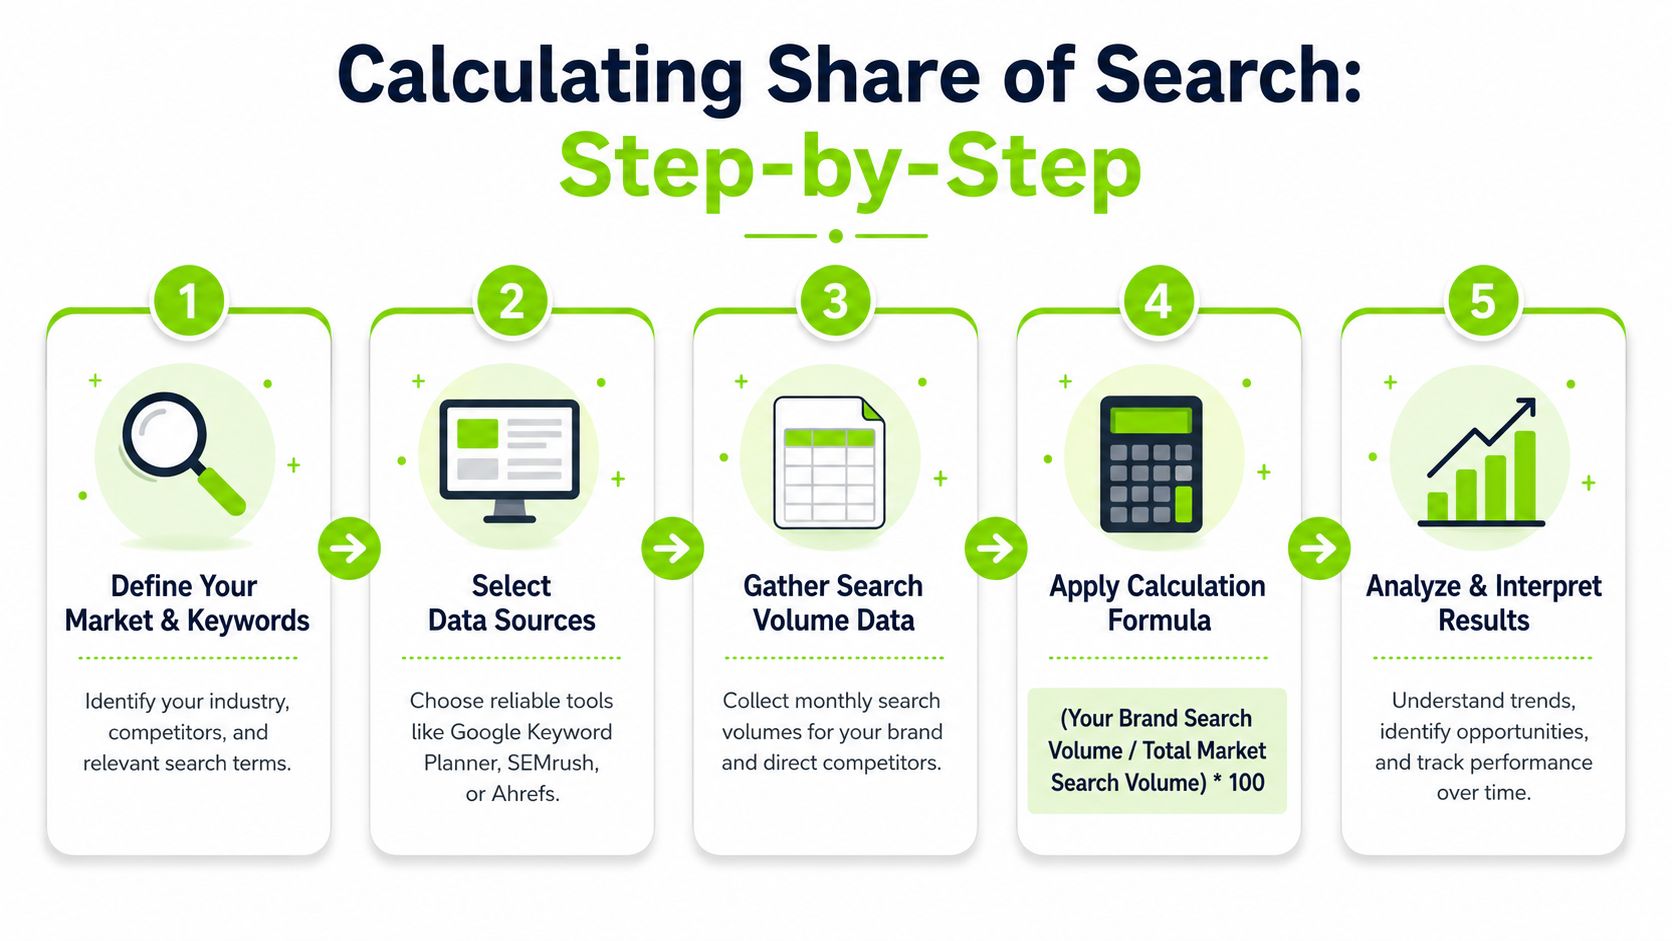
Start with the formula
A common method is to divide a brand's organic search volume by the combined branded search volume of all brands in the category, then multiply by 100. Qualtrics also recommends using Google Trends topic data, not just keyword terms, because topics aggregate semantically related queries and reduce noise in its guide to share of search.
In plain terms:
- Build your competitor set.
- Gather branded search demand for each brand.
- Add all brand volumes together.
- Divide your brand's volume by the category total.
- Track the result over time.
The formula is straightforward. Category design is not.
Pick a competitor set you can defend
Many reports frequently go wrong. Teams either include too many brands and dilute the picture, or include only a few direct rivals and miss the category reality.
Use a set that reflects how buyers compare options. In some markets, that means parent brands. In others, product lines matter more. The key is consistency. If you keep changing the brand set, the trend stops meaning anything.
A useful rule set:
- Keep geography fixed. Don't compare one brand in the US against a category total built from global demand.
- Keep the same time window. Don't switch from monthly to quarterly inputs midway through reporting.
- Handle subsidiaries carefully. Some brands deserve separate tracking, others should be grouped.
Choose your data source based on the job
Google Trends is often the best starting point for directional analysis. It's fast, accessible, and strong for comparing relative brand interest over time.
Search volume tools can help when you need more granular keyword-level estimates. Teams often use platforms such as Google Keyword Planner, Ahrefs, or Semrush to build a branded keyword list and estimate monthly volume. That approach gives more control, but it also creates more maintenance work because you have to manage variants, misspellings, and branded modifiers manually.
Here's the trade-off:
| Method | Good for | Watch out for |
|---|---|---|
| Google Trends | Relative trend comparison across brands | Index-based data needs careful interpretation |
| Search volume tools | Building explicit branded query sets | Keyword lists get messy and stale |
| Hybrid approach | Executive trend plus analyst detail | Requires stronger process discipline |
If you also track broader search visibility, it helps to compare share of search against a separate visibility score framework. One tells you whether people are looking for you. The other tells you how much search exposure you hold. Those are different signals.
Don't force precision where the data is naturally directional. A stable methodology beats a false sense of exactness.
Clean the dataset before you trust it
Three problems show up repeatedly in real-world calculations:
- Ambiguous brand terms. Some brand names overlap with common language or unrelated entities.
- Unbalanced query sets. One competitor gets tracked with every variant while another gets only its root term.
- Short reporting windows. Monthly views are useful, but raw month-to-month swings can overstate change.
This is why practitioners often prefer smoothed views and documented assumptions. If someone else on the team can't recreate the method, the report won't survive scrutiny.
Actionable Strategies to Grow Your Share of Search
You don't grow share of search by staring at the chart. You grow it by increasing brand salience, strengthening discovery, and giving people more reasons to remember and seek you out later.
Because Google held 90.02% of worldwide search engine market share in April 2026 according to Statcounter's search engine market share data, Google-based share of search analysis is a practical proxy for branded intent in many markets. That also means small changes in branded demand there deserve attention.
Build demand, don't just harvest it
A lot of SEO work is built to capture existing demand. Share of search improves when you also create it.
That usually comes from activities outside narrow SEO deliverables:
- Product launches that are easy to remember. Clear naming helps people search the brand later.
- Distinctive campaigns. If the message is generic, people won't recall who said it.
- Strong customer experience. Buyers often search for brands after hearing about them from peers.
This is why share of search is useful across departments. SEO can't own the metric alone. Brand, PR, content, social, and product marketing all influence it.
Use PR as a search demand lever
Press coverage often gets judged by placements. That's incomplete. A better question is whether the coverage increased branded interest.
Good digital PR creates a second-order effect. People see the announcement, hear about the company, then search the brand later for validation or more detail. If your team wants a practical playbook, this guide to PBJ Stories press release optimization is useful because it connects announcement structure with search discoverability.
Focus on brand-led content patterns
Content that grows share of search usually does one of three things well:
- Clarifies the brand's category position. Buyers need to know what you're known for.
- Creates repeatable branded associations. That can be a product method, framework, or named feature.
- Supports post-discovery research. When people hear about you elsewhere, they need to find convincing brand-owned content fast.
A lot of teams overinvest in generic top-of-funnel content and underinvest in branded and semi-branded content. That hurts demand capture when awareness starts rising.
If people search your brand after hearing about you and land on weak brand pages, you waste the demand you just created.
Improve recall across the whole search journey
The strongest programs usually combine several layers:
- Technical hygiene so branded pages are crawlable, indexable, and clearly structured.
- Brand SERP control through strong homepage, about, comparison, review, and documentation assets.
- Message consistency across search, social, PR, and sales materials.
- Measurement loops that tie brand activity back to branded demand shifts.
If you want one workflow instead of juggling separate views, Surnex includes a share of search tool alongside broader AI and SEO visibility tracking. That makes it easier to compare branded demand trends with what's happening in search surfaces themselves.
The key point is simpler than the tooling. You increase share of search when more people remember your brand name and choose to look for it. Everything else is implementation detail.
The Future of Search Share in the Age of AI
Most explanations of share of search still assume a classic behavior pattern: a user types a brand or category into a search engine, scans results, clicks a website, and continues from there. That model still exists. It just doesn't describe the whole journey anymore.
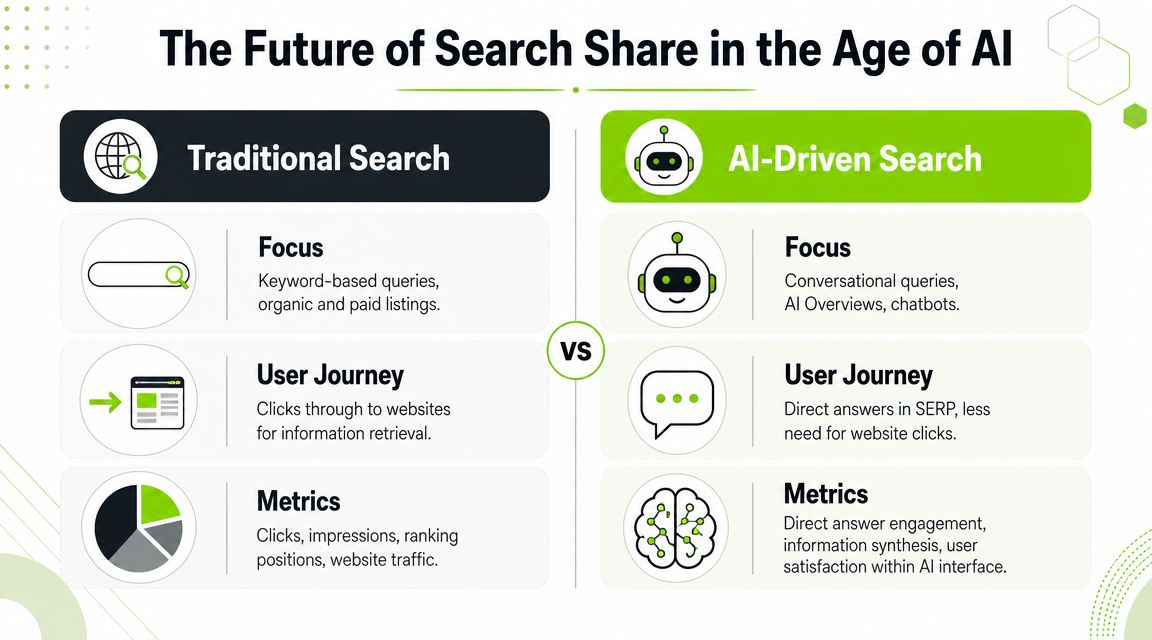
Why the old definition is no longer enough
The search experience is shifting toward summaries, synthesized answers, and assistant-like interfaces. Gartner projected that traditional search volume could drop 25% by 2026 due to AI chatbots, while Google said AI Overviews reached over 1.5 billion users monthly in more than 100 countries, as summarized in 42Signals' discussion of share of search and AI discovery.
That changes measurement. If users get answers without clicking, then classic traffic metrics lose diagnostic power. A brand can influence the answer layer and still receive fewer visits than it would have in an older SERP environment.
From share of search to share of answer
The metric must evolve. Traditional share of search measures branded query demand. AI-era visibility also needs a way to measure:
- Share of answer, meaning how often a brand appears in generated responses
- Share of citation, meaning how often a brand or its content is referenced as supporting evidence
- Share of recommendation, meaning whether the brand is included when users ask for options, comparisons, or best-fit suggestions
These are not replacements for share of search. They are companion views.
A practical pattern is to treat them as a sequence. A buyer may first encounter a brand in an AI Overview or chatbot response, then later search for the brand name directly. In that model, AI visibility feeds branded demand, and share of search becomes the downstream confirmation.
How to begin measuring AI-era visibility
You don't need a perfect AI metric on day one. You need a repeatable one.
Start with a prompt set that reflects real buying questions. Track whether your brand appears, how often competitors appear, and what sources are cited. Then compare those patterns against branded search demand over time. For teams building this capability, an AI Overview tracker is useful because it turns scattered SERP observations into something more systematic.
Teams in specialized verticals are already adjusting to this shift. For example, this resource on mastering AI search for real estate professionals shows how AI discovery changes visibility work in a high-consideration market.
Search share used to mean “who gets searched for.” It now also needs to answer “who gets surfaced before the search happens.”
Building a Share of Search Report for Stakeholders
A stakeholder report should do more than present a percentage. It should explain movement, competitive context, and likely causes.

What to include in the report
A useful share of search report usually includes these elements:
- Trend line over time showing your brand and key competitors
- Current category snapshot so executives can see relative position quickly
- Annotated events such as launches, PR moments, pricing changes, or site migrations
- Short interpretation explaining what likely drove the movement
- Recommended action tied to brand, content, PR, or AI visibility work
A simple dashboard often works better than a dense slide deck. If the audience needs deeper brand analysis, pair the metric with a structured branded SEO reporting approach so the story connects branded demand, search presence, and business impact.
How to make the number credible
Use plain language. Document your competitor set. State the geography and date range clearly. If the method changed, say so.
That transparency matters more than cosmetic precision. Stakeholders don't need a perfect market model. They need a metric that is stable, interpretable, and useful for decisions.
Surnex helps teams track how brands show up across both traditional search and newer AI discovery surfaces. If you need one place to monitor AI Overviews, branded visibility, and the broader search signals that now shape demand, Surnex is built for that workflow.