You usually notice the problem at the worst possible time. A report is due in the morning, a hand-run script fails after midnight, and someone has to wake up, patch the query, rerun the load, and hope the numbers still match what finance or a client expects. That kind of scramble is why data pipeline automation has become a control problem, not just an efficiency project.
The pressure is easy to understand. As data moves through more sources, more teams, and more downstream tools, manual handoffs create brittle points that are hard to see until something breaks. The market signal reflects that shift, too. The global data pipeline tools market was valued at USD 6.9 billion in 2022 and is projected to reach USD 17.6 billion by 2027, a 20.3% CAGR over that period, according to MarketsandMarkets. For practitioners, that growth isn't hype, it's a sign that teams are moving from scripts toward systems that can ingest, transform, validate, and deliver data with less human intervention.
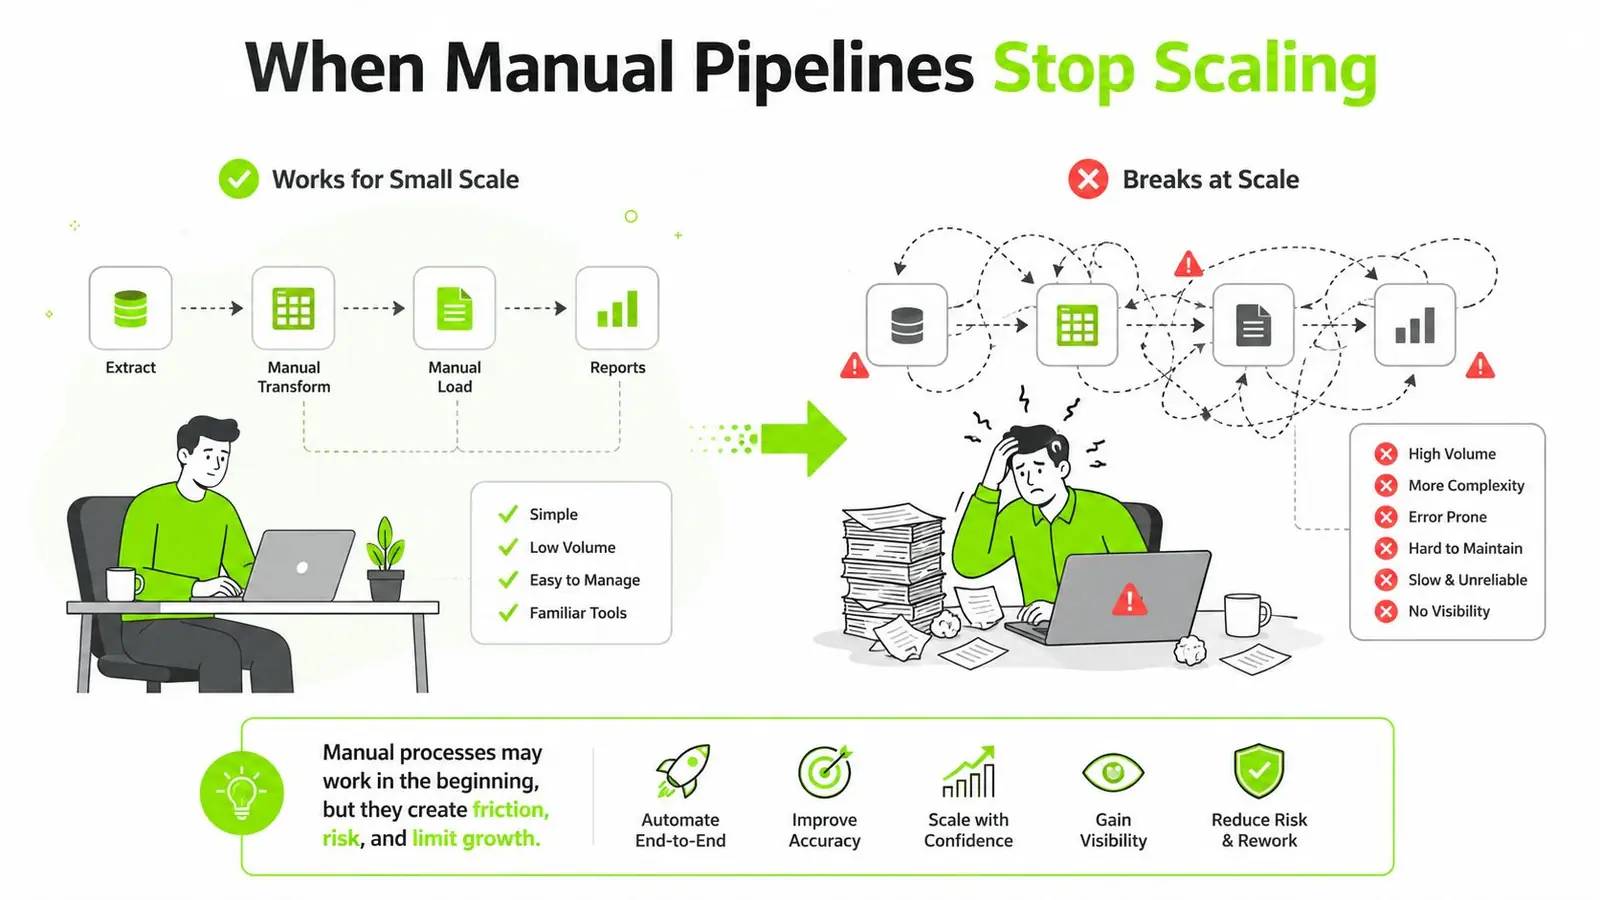
When Manual Pipelines Stop Scaling
The breakage rarely starts with a dramatic failure. It starts with one spreadsheet export that lands late, one API response that changes shape, or one analyst who forgets to rerun a filter before the exec deck goes out. After a few of those incidents, the team stops trusting the pipeline and starts treating every run like a manual recovery exercise.
That's the moment automation stops being a convenience and becomes infrastructure. Industry analysis has tied ETL automation to an average payback period of about 4.2 months and a 328% ROI over three years in cohort research cited by Integrate.io. The business case is straightforward, repetitive work gets removed, failures surface earlier, and delivery stops depending on whoever happens to be on call.
What usually hurts first
The first pain point is usually not compute cost, it's coordination cost. People spend time chasing source owners, checking whether a load finished, and reconciling mismatched numbers across reports. That overhead grows quickly when pipelines are still hand-scripted.
A second pain point is confidence. If the team cannot tell whether data is fresh, complete, or transformed correctly, every dashboard becomes a debate instead of a decision tool. That's why mature automation is built to do more than move rows, it has to schedule work, retry failures, validate inputs, and make exceptions visible before someone else finds them.
If you're planning a broader platform move, it helps to compare your current handoffs with resources for cloud migration planning so the pipeline work doesn't get separated from the rest of the stack change.
Practical rule: if a person has to be present for every successful run, the system still isn't automated, it's just scheduled.
The Five Building Blocks of an Automated Pipeline
A daily SEO visibility feed is a clean example because the failure modes are familiar. Data arrives from APIs, lands in a warehouse, gets reshaped for reporting, and then drives dashboards or alerts. If any stage is weak, the entire chain becomes suspect.
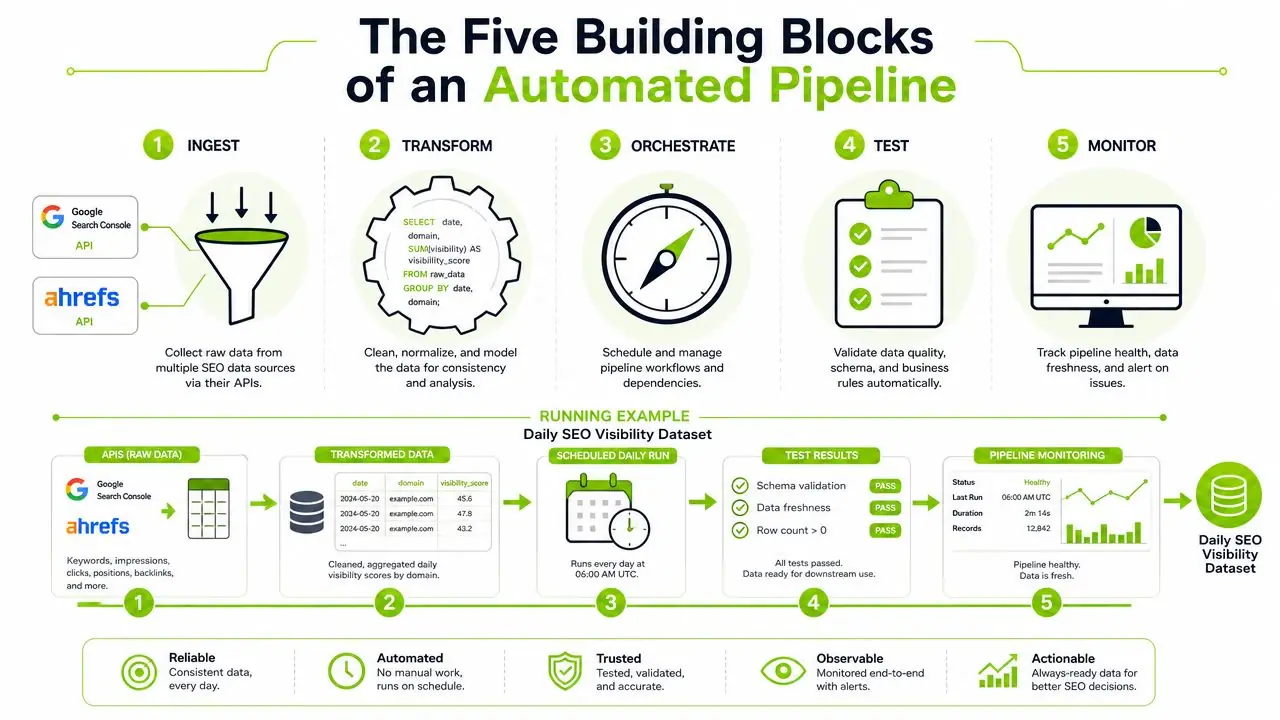
The source-to-dashboard path is the right way to think about the stack, not as isolated tools. A developer's guide to content automation is useful context here because the same discipline applies whether you're moving rankings, product events, or campaign metadata. One internal example that's relevant for teams building reporting layers is this data analytics dashboard framing, where the pipeline's job is to keep the dashboard trustworthy, not just populated.
Ingest and stage
Ingestion is where raw data comes in from Google Search Console, Ahrefs, databases, or SaaS APIs. Good ingestion preserves timestamps, source identifiers, and basic metadata so later troubleshooting has a trail to follow. Staging then isolates raw data from downstream logic, which is what keeps a transient source issue from contaminating the whole warehouse.
Transform and test
Transformation is where business rules live. You standardize field names, normalize dates, join dimensions, and remove duplicates. Testing belongs right next to that logic, because it catches schema drift and malformed fields before they reach reporting. The point is not to test everything, it's to test the failure modes that have burned your team before.
Orchestrate and monitor
Orchestration decides what runs first, what retries, and what happens when a step fails. Monitoring answers the harder question, did the pipeline complete correctly, and is the output still trustworthy? That distinction matters, because a green job status can still hide broken joins, missing source rows, or stale data.
A useful audit checklist for each block is simple:
- Ingest: Are source credentials, timing, and schema changes handled cleanly?
- Stage: Can raw data be replayed without re-pulling from the source?
- Transform: Are business rules versioned and reviewable?
- Test: Do checks catch the failures that matter most?
- Monitor: Can someone see freshness, volume, and correctness fast enough to act?
Orchestration Patterns That Hold Up in Production
Teams don't choose one orchestration style and stick with it forever. They blend batch, micro-batch, and streaming based on how quickly a decision needs to be made and how much complexity they can afford to run. The right choice depends on the decision, not the trend.
The comparison below is the practical way to think about it.
| Pattern | Best fit | Operational shape | Trade-off |
|---|---|---|---|
| Batch | Nightly reporting and historical analysis | Runs on a schedule, usually once per day or at another fixed interval | Lower operational complexity, but data is less current |
| Micro-batch | Dashboards and trend detection | Runs frequently in smaller chunks | Better freshness, more moving parts |
| Streaming | Alerts and anomaly detection | Processes events continuously | Fastest response, highest complexity |
Nightly executive reporting usually belongs in batch because the decision doesn't need second-by-second freshness. Hourly ranking refreshes are often a better fit for micro-batch because the team wants a current view without carrying full streaming overhead. Real-time anomaly detection is where streaming starts to earn its keep, but it also introduces harder failure recovery, more dependency management, and more expensive operational discipline.
Retries, backfills, and dependencies
Dependency graphs matter because they make failure order visible. When one upstream job fails, orchestration should stop downstream work instead of producing partial outputs that look complete. Retries help with transient faults, but they're not a cure-all. If the source schema changed, retrying the same broken transformation just repeats the problem.
Backfills are another place where teams overcomplicate things. A good pipeline lets you rerun a missed date range or a corrected source window without manual surgery on production tables. That's especially important when you're fixing a source issue after the fact and need the data to reconcile cleanly.
The best orchestration design is the one the on-call engineer can reason about at 2 a.m. without guessing which job owns which failure.
The mechanics are easier to understand if you already know Python-based workflow logic, and that's one reason teams often pair pipeline design with skills from a Python for SEO workflow.
CI/CD and Infrastructure as Code for Data
The biggest mindset shift is treating data pipelines like software artifacts, not a pile of scripts someone happens to run from a laptop. Once transformation logic lives in version control, changes become reviewable, testable, and reversible. That matters because most pipeline failures come from small edits that looked harmless at commit time.
Pre-merge validation should check the things that break pipelines most often. That means schema checks, transformation tests, and environment-specific config checks before anything reaches production. Infrastructure as code belongs in the same discipline, because warehouses, orchestration jobs, service accounts, and network rules should be reproducible instead of hand-built in a console.
A small team doesn't need a huge platform to start. It needs a clean release path.
| Stage | Practices | Typical Tools | Outcome |
|---|---|---|---|
| Manual deploys | Ad hoc edits, direct changes in production | Spreadsheet notes, console clicks, one-off scripts | Fast at first, fragile later |
| Scheduled releases | Changes bundled and deployed on a cadence | Git, scheduled jobs, review checklists | More predictable, still partly manual |
| Fully automated promotion | Tests gate merges, deploys move through environments automatically | GitHub Actions, dbt, Airflow, Terraform | Safer changes, repeatable releases |
The minimum viable version is usually version control plus automated tests plus one non-production environment. From there, promotion can be staged so the logic proves itself before it touches live reporting. That's far more useful than trying to automate every part of delivery on day one.
Testing, Data Quality, and Observability
Speed is not the primary payoff of automation, quality is. A pipeline that runs quickly but loads the wrong thing is just a faster way to lie to the business. Production systems rely on four controls that keep that from happening, idempotent writes, stage-level expectations, pre-release tests, and proactive alerting, and each one stops a different kind of failure.
Idempotent writes prevent duplicate rows when a job reruns. Stage-level expectations catch bad values before they reach the warehouse, which is where fixing them becomes expensive. Pre-release tests catch logic regressions before deploy, and proactive alerting tells the team when freshness slips or volumes behave strangely.
This is also where people confuse pipeline observability with data observability. Pipeline observability asks whether the job ran, failed, retried, or completed on time. Data observability asks whether the output is right. A green task status is useful, but it's not enough if the load dropped a key dimension or changed a metric definition.
What to instrument first
Start with the metrics that help someone act, not the ones that make a dashboard look busy. Freshness, row count changes, schema changes, and null spikes are usually enough to catch the first wave of problems. If those are under control, then add more granular checks.
For teams in regulated or customer-facing environments, a product like Visbanking helps banking executives think about data quality as an operational discipline rather than a reporting afterthought. The same principle applies outside banking. Quality checks work best when they're visible, tied to owners, and reviewed before someone downstream notices the problem.
Practical rule: alerts should point to a fix, not just confirm that something is broken.
For SEO teams, the same mindset shows up in automated SEO monitoring, where freshness and anomaly checks matter more than raw notification volume.
Governance, Security, and the Human Override
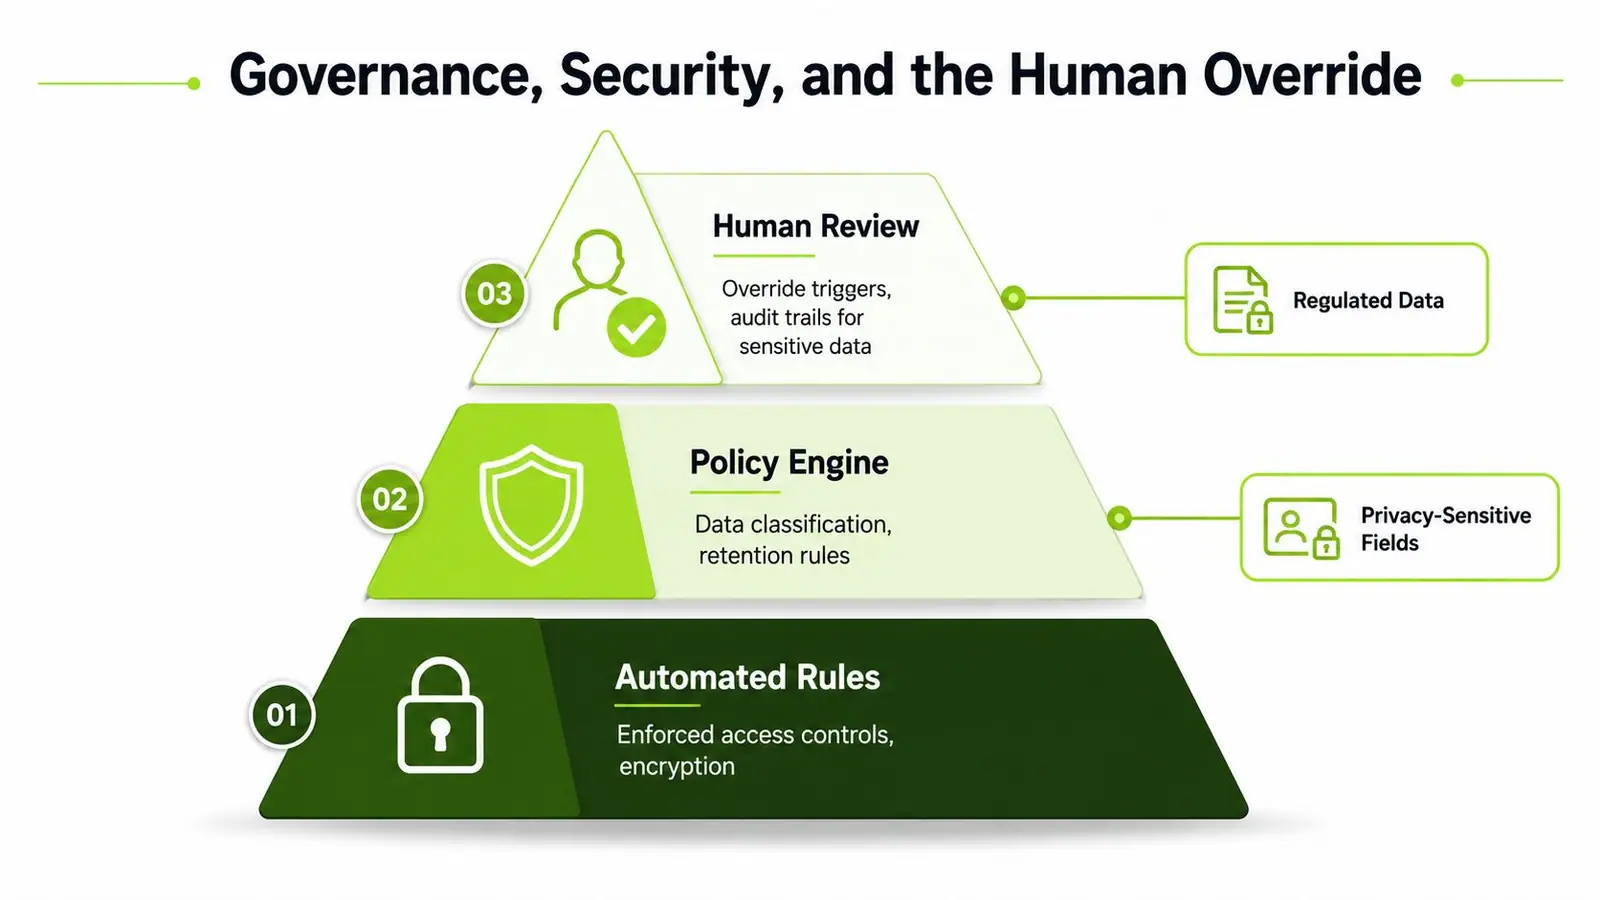
Automation gets risky when teams assume every decision should run unattended. That assumption breaks fastest in regulated and privacy-sensitive environments, where lineage, policy enforcement, and auditability aren't optional. In those settings, the goal isn't full autonomy, it's controlled autonomy with a clear override path.
Automated lineage capture is one of the most underused controls because it turns a moving pipeline into something auditors and engineers can inspect later. Role-based access limits who can see or alter sensitive stages, and policy-as-code makes those rules repeatable instead of tribal knowledge. Those controls matter most when data structures change often, because every change is also a potential compliance event.
The hardest operational question is where the human needs to stay in the loop. The answer is usually not “everywhere” or “nowhere.” Low-risk tasks such as routine ingestion, standard transformations, and scheduled loads can run with very little intervention. Higher-impact actions, especially anything involving regulated data, privacy-sensitive fields, or AI-assisted decisions, should trigger review, logging, or approval.
Tiered autonomy works better than blanket automation
A tiered model is easier to defend. Start with non-sensitive flows that can be fully automated, then require review for tasks that can affect customer data, financial reporting, or policy boundaries. That approach lines up with guidance that recommends starting small, validating manually first, and expanding gradually, rather than handing the entire pipeline to automation on day one, as discussed in Acceldata's guidance on automated data pipelines.
The same caution applies when AI sits inside a pipeline. Model outputs can fail without obvious signals, especially when they look plausible. If a model suggests a schema mapping, flags an anomaly, or generates a transformation, the pipeline should preserve the decision trail and make it easy for a human to inspect the result later.
Integrating APIs, AI Assistants, and LLM Workflows
Modern pipelines rarely end at the warehouse. They feed dashboards, search tools, assistants, and retrieval systems that need clean, current data to answer questions correctly. If the pipeline is stale or inconsistent, the downstream AI layer just turns bad inputs into confident answers.
Event-driven triggers are the cleanest way to connect source systems to consumers that need fresh data. A source update can kick off ingestion, validation, and transformation automatically, then push the cleaned output to whatever model, dashboard, or workflow sits downstream. Schema contracts matter here because AI consumers tend to fail in messy ways when upstream fields shift without warning.
Teams building on top of search and analytics data need to be especially careful. The SEO tool API pattern is a good example of how cleanly structured pipeline output can feed product features, client reporting, or assistant workflows without manual copying. The same structure works for retrieval-augmented generation systems, internal assistants, and scoring models that depend on consistent source data.
Feedback loops need guardrails
Feedback loops are useful when model outputs become new inputs. They help the system learn from edits, corrections, and downstream usage. They also create risk if bad output gets recycled without review, so keep the loop explicit and log the human changes that matter.
The safest pattern is simple. Raw data enters once, validated data gets published, and downstream AI consumers rely on the published layer, not the source. That boundary keeps the pipeline understandable and makes it much easier to debug when the assistant gets a question wrong.
Your 90-Day Rollout and What to Do Next
A practical rollout works best in three phases. In the first 30 days, discover the fragile paths, the manual handoffs, and the one or two datasets that cause the most pain. In the next 30 days, build a staged pipeline with version control, tests, orchestration, and monitoring. In the final 30 days, stabilize the flow, tune alerts, and document who can override what.
For digital marketing agencies, the best first win is usually a client reporting feed that removes manual exports and reduces reconciliation work. In-house SEO teams often get the most value from a monitored ranking and visibility pipeline with strict freshness checks. Developers and data engineers should focus on contracts, retries, backfills, and the human review points that keep automation safe.
The common mistakes are predictable. Teams over-automate too early, skip data contracts, or wire alerts so noisily that nobody trusts them. The fix is equally predictable, start with one low-risk path, define the acceptance checks up front, and expand only after the first flow is stable.
If you're building a modern search or analytics stack, Surnex helps teams keep AI visibility, rankings, backlinks, audits, and content opportunities in one place instead of scattering them across tools. It's a fit when you want pipeline-driven reporting that stays current and supports both manual review and API-based automation. Visit Surnex to see how a cleaner data flow can make search reporting easier to trust and easier to scale.