You've probably seen it already. A GEO dashboard says your brand appeared in an AI answer yesterday, then drops sharply today. A colleague shares a screenshot from ChatGPT showing a competitor cited ahead of you, while your organic rankings haven't changed. Leadership asks whether the movement represents real progress, and the honest answer is often, “We need better instrumentation.”
How to measure generative engine optimization starts with accepting that AI visibility isn't a replacement metric for SEO. It's a separate discovery surface with different inputs, different failure modes, and different evidence requirements. The practical answer is a dual-ledger system: measure organic performance in one ledger, AI-answer inclusion in another, and connect them only where the data supports an overlap.
Why Measuring GEO Feels Harder Than SEO
Traditional SEO gives teams a familiar object to measure. A page ranks in a position, receives impressions, earns clicks, and contributes to conversions. Search Console and rank trackers provide a reasonably consistent historical record, even when results fluctuate.
AI answer engines work differently. A prompt sent to ChatGPT, Perplexity, Gemini, or an AI Overview can produce a different answer, citation set, or source order in another session. There's no universal position three to record, and scrape logs may not tell you whether a response came from the same model, retrieval system, or answer configuration.
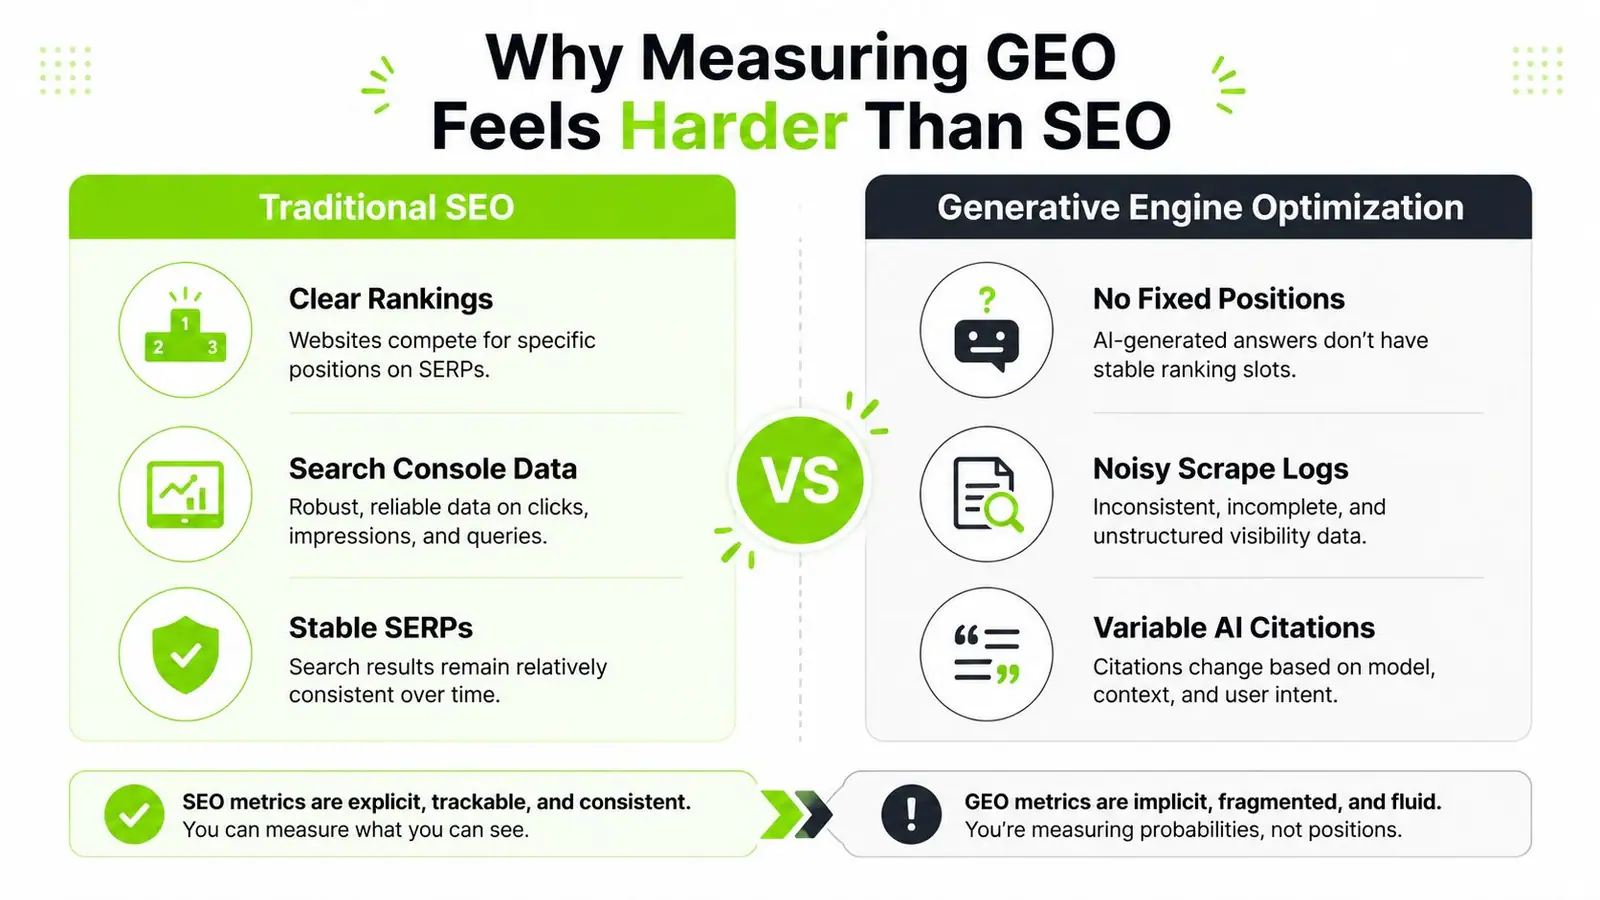
A marketer can therefore watch an apparent visibility decline that is really a sampling artifact. The reverse also happens. One unusually favorable answer can make a weak program look successful if the team reports a screenshot rather than a repeated sample.
Practical rule: Treat every AI visibility number as a sample from a changing response distribution, not as a permanent rank.
The original Princeton-led GEO research tested optimization methods across a 10,000-query benchmark and found that interventions involving quotations, statistics, and citations could improve visibility in generative responses by up to 40% overall. The same research found that results varied by tactic and starting rank, including a 115.1% visibility gain for fifth-ranked websites from source citations, while first-ranked websites lost 30.3% under that tactic. Those findings make context essential, and they're documented in the original GEO research paper.
The practical implication is straightforward. A rank tracker can't answer whether your brand was cited, how prominently it appeared, whether the citation was linked, or whether the answer used your evidence. A useful overview of the discipline is available in what generative engine optimization means for search teams, but measurement needs its own operating model.
Early dashboards often collapse mentions, citations, and links into one score. That's the first error to remove. A brand can be mentioned without a source link, linked without influencing the answer, or cited in a low-value passage that doesn't support the buyer's decision. GEO deserves independent instrumentation, even when the same content and technical teams support both channels.
Defining the Core GEO Metrics
Start with a small vocabulary that everyone uses consistently. The most advanced model won't help if one analyst calls an unlinked brand reference a citation and another counts only linked sources.
AI Visibility Rate
AI Visibility Rate measures how often your entity appears in sampled responses:
AI Visibility Rate = responses mentioning your entity ÷ total sampled responses × 100
For citation visibility, use a stricter numerator, responses that cite a page or domain you control. The 2026 AI search visibility measurement framework recommends sampling the same query set across surfaces and separating mentions, linked citations, and position. That distinction prevents a flattering mention rate from hiding weak source attribution.
Citation Share of Voice
Citation Share of Voice compares your citations with a defined competitor set:
Citation Share of Voice = citations to your domain ÷ citations to all tracked domains × 100
Define the competitor group before collecting results. Otherwise, teams tend to add competitors after seeing them appear, which makes historical comparisons unstable. For broader brand measurement, the share of search guide from Agent Central offers useful context for thinking about share metrics, but AI citations still require their own denominator and extraction rules.
Mention Rate and Citation Rate
Track both rates side by side:
| KPI | Formula | Best Used For |
|---|---|---|
| AI Visibility Rate | Entity mentions ÷ sampled responses × 100 | Brand presence |
| Citation Rate | Responses citing your source ÷ sampled responses × 100 | Attributable visibility |
| Citation Share of Voice | Your citations ÷ all tracked citations × 100 | Competitive comparison |
| Sentiment-Adjusted Visibility | Weighted positive, neutral, and negative mentions | Brand quality |
| Citation Depth | Linked and unlinked source influence by answer location | Citation usefulness |
A mention is not proof that the engine relied on your content. Citation Rate is the stronger operational KPI when the objective is source selection. Still, Mention Rate can outperform a theoretically perfect citation metric when linked-source extraction is incomplete or an engine provides limited citation metadata.
Sentiment-Adjusted Visibility
Classify each brand reference as positive, neutral, negative, or ambiguous. Then apply a documented weighting system, such as counting positive visibility fully, neutral visibility separately, and negative visibility as a risk signal rather than blending it into a single score.
The judgment call matters more than the formula. A legal, healthcare, or financial brand may care more about harmful framing than raw inclusion. Store the original answer and the classification rationale so a reviewer can challenge the label.
Citation Depth
Citation Depth asks what the source contributed. Record whether the source is linked, where it appears in the answer, how much of the answer reflects its facts or language, and whether the citation supports the buyer's intent.
A 2026 measurement framework describes citation absorption as the depth with which a source's evidence, structure, facts, or language enters the final answer. Its influence score uses reference count, first-position ratio, paragraph coverage, TF-IDF similarity, and n-gram overlap, bounded between 0 and 1. You can adopt that full model or use a simpler ordinal scale if your sample is small. Consistency beats theoretical sophistication.
Normalize results by engine. ChatGPT, Perplexity, Gemini, and AI Overviews don't expose identical citation behavior, so publish both an overall view and an engine-level breakdown. That keeps one platform's response style from dominating the report.
Building Your AI Visibility Measurement Stack
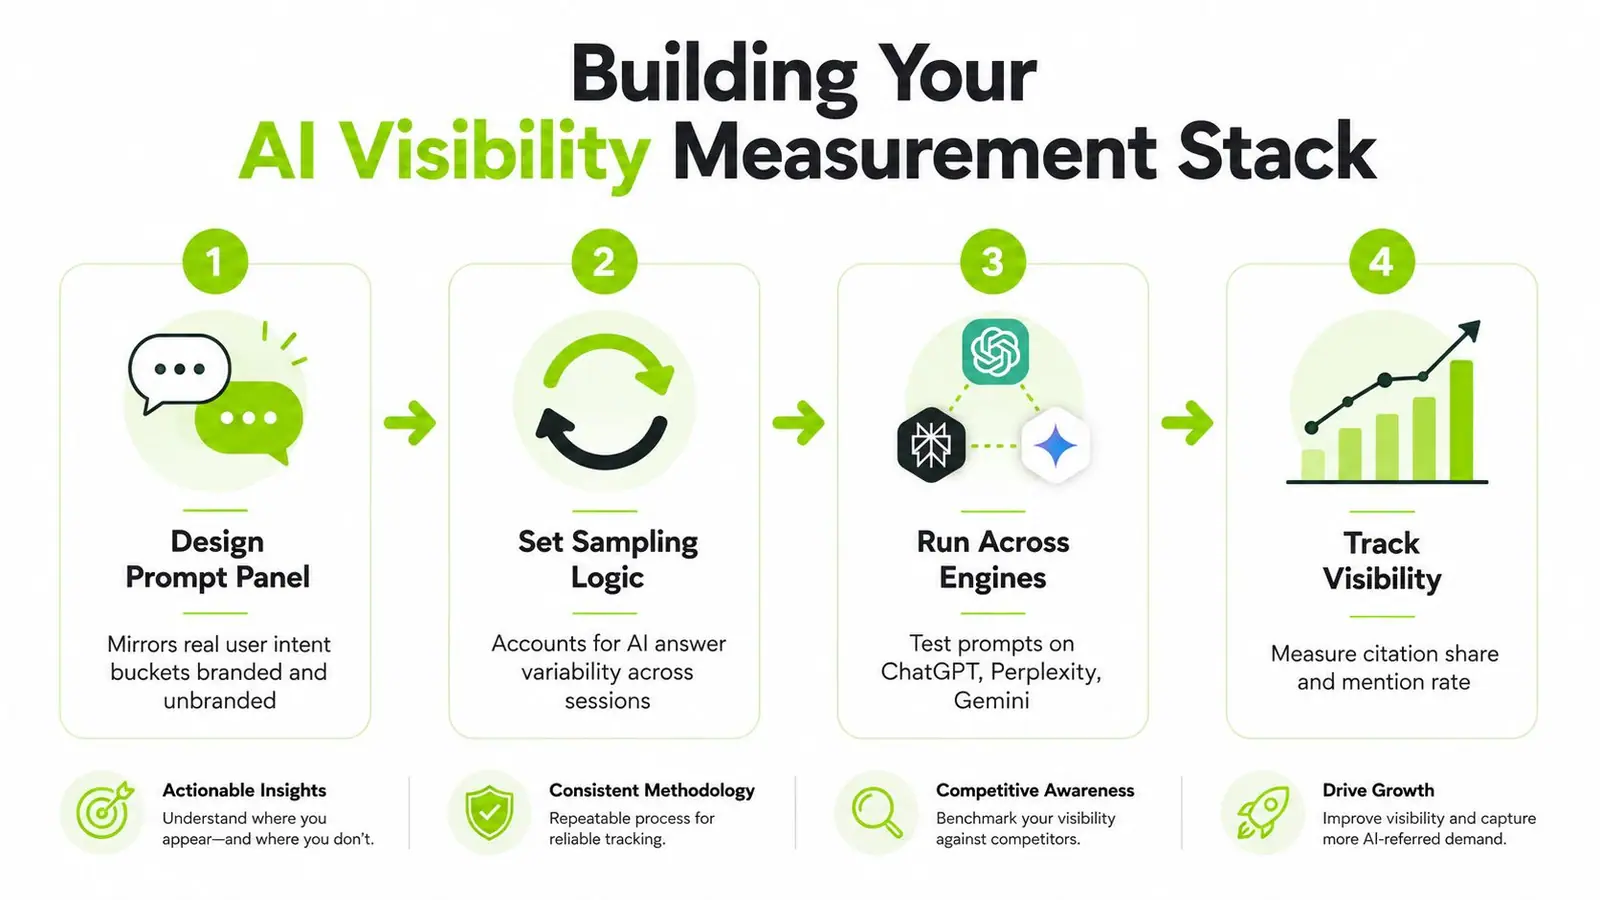
The stack begins with the prompt panel, not the dashboard. Build queries from actual buyer language, support tickets, sales calls, category research, and Search Console themes. Separate branded from unbranded prompts, informational from transactional intent, and product-specific questions from broader category comparisons.
A practical panel contains 30 to 60 buyer-intent queries, then runs the same prompts on the same platforms three times per measurement cycle, as recommended in the AI search visibility measurement methodology. Freeze the panel during a reporting period. If you change the prompts halfway through, you can't tell whether visibility moved because the brand improved or because the test changed.
Capture the full response context
Each observation should preserve more than a yes or no value. Store:
- Prompt identity: A stable prompt ID, prompt text, intent bucket, and prompt version.
- Execution context: Engine, model or surface, timestamp, locale, device context where relevant, and run ID.
- Response evidence: Raw answer text, cited URLs, cited domains, mention locations, answer position, and extraction confidence.
- Experiment flags: Test or holdout status, content intervention, and deployment date.
Keep engine and model as separate fields. “Google AI Overview” describes a surface, while the underlying model or retrieval configuration may change. If those values share one field, later analysts won't know whether a movement came from a platform change or model change.
Citation extraction and mention extraction should also be separate processes. Use URL parsing and regular expressions for explicit links, then apply an LLM-as-judge pass to classify implicit mentions, source attribution, answer position, and sentiment. Have the judge return structured JSON, validate the schema, and retain the raw response for audit review.
A scheduled API workflow can write each observation to a warehouse. Add retries with backoff, rate-limit status, and a dead-letter queue. Silent sample loss is worse than a visible failed run because it creates false confidence in the trend line.
For teams comparing monitoring products, the Surnex guide to AI Overview monitoring tools provides a useful starting point for evaluating coverage and reporting requirements.
The video below gives teams another practical way to think about the shift from isolated checks to repeatable AI visibility operations.
Designing GEO Experiments That Actually Prove Lift
Don't treat every GEO recommendation as a proven best practice. Treat it as a hypothesis with a test group, a holdout group, a measurement window, and a decision rule.
For each commercial intent cluster, create matched prompts. Keep a holdout set unoptimized while applying one intervention to the test set. Candidate interventions include adding authoritative citations, restructuring answer-first passages, improving schema, or making evidence easier to extract. Isolate the variable. If you change page structure, add statistics, and publish new references at the same time, the result may look positive while teaching you nothing about causation.
A holdout doesn't eliminate every confounder. Model updates, seasonal demand, competitor publishing, and retrieval changes can affect both groups. Record those events beside the result rather than hiding them in a footnote. Statistical measurement guidance warns that single-run results can look more precise than they are, so use repeated samples and report uncertainty instead of presenting a point estimate as fact. The performance benchmarking guide is useful background for establishing comparable baselines before an intervention begins.
| Variable | Recommended Setting | Common Pitfall |
|---|---|---|
| Prompt set | Matched test and holdout groups by intent | Mixing unrelated query types |
| Intervention | One material change per cycle | Bundling several changes |
| Measurement window | Long enough to observe retrieval changes | Ending after an isolated response |
| Primary KPI | Citation Rate or Citation Share of Voice | Switching metrics after results arrive |
| Confidence method | Proportion test or bootstrap | Reporting precision without uncertainty |
| Documentation | Pre-registered effect and stop rule | Extending a weak test indefinitely |
Use a proportion z-test when the sample is large enough for its assumptions. For smaller panels, bootstrap the prompt-level observations and report an interval around the difference. The exact method matters less than stating what you used, what the unit of analysis was, and how you handled repeated runs.
Pre-register the expected direction, minimum useful effect, and stop conditions. If the test fails to clear the decision threshold, call it inconclusive or negative. A dashboard should support learning, not create a reason to keep a weak experiment alive.
Connecting GEO to Traditional SEO Without the Trap
Organic rank and AI citation visibility overlap, but they aren't interchangeable. A March 2026 Ahrefs analysis of 863,000 SERPs and 4 million AI Overview URLs found that only 38% of cited pages also ranked in the top ten, compared with 76% seven months earlier. The analysis of AI Overview citation patterns documents why teams need separate ledgers rather than assuming ranking improvements predict citation inclusion.
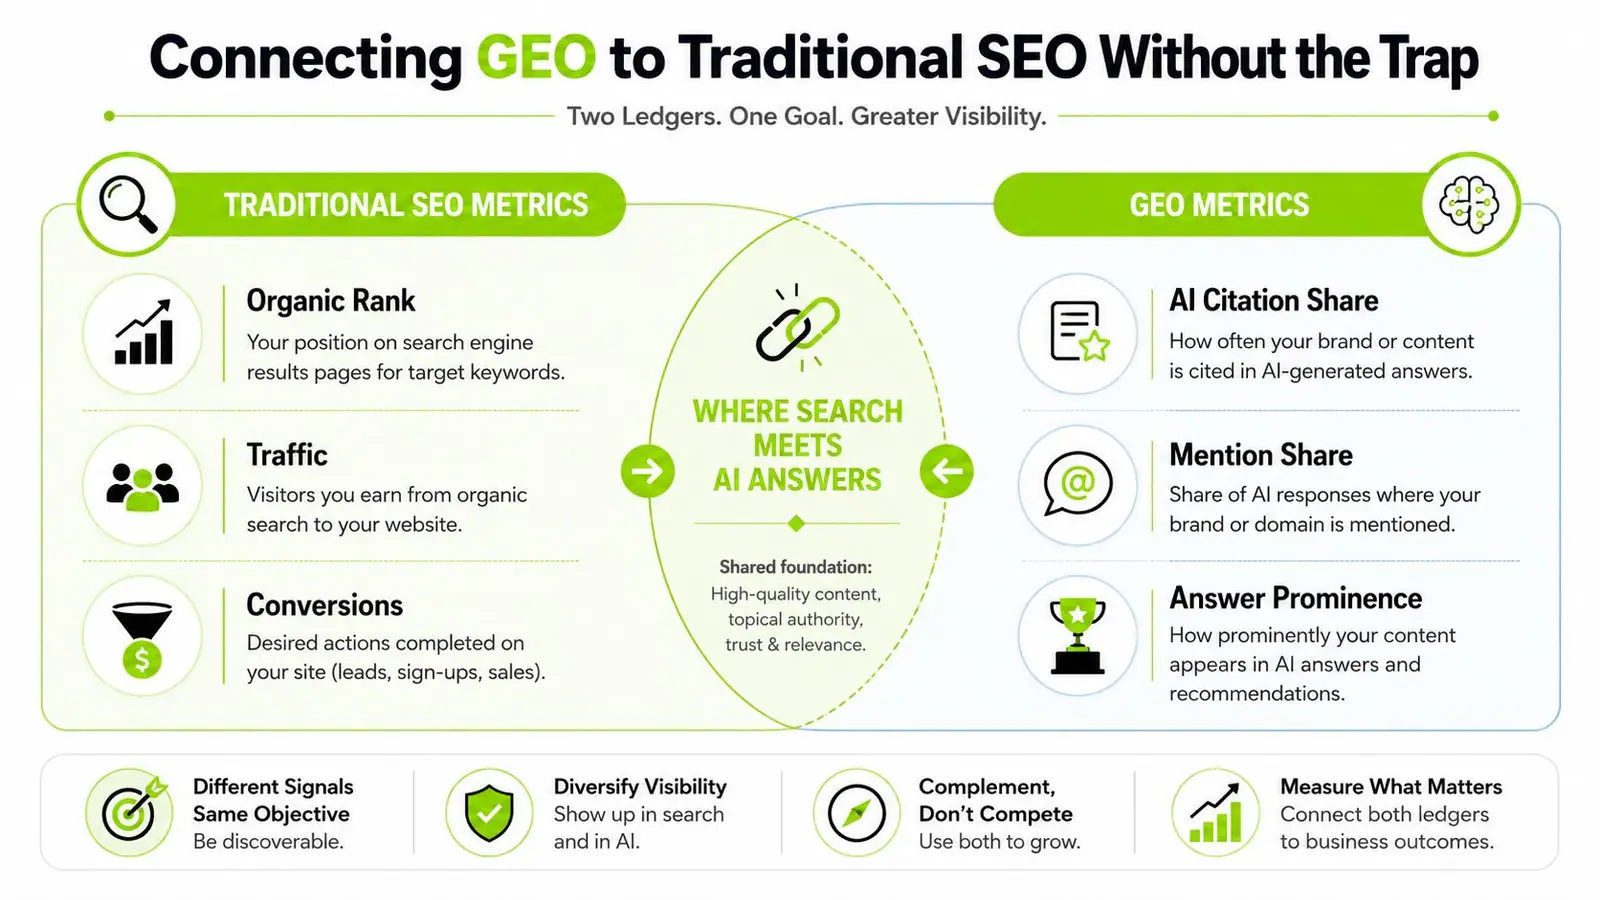
The traditional ledger should contain organic rank, impressions, clicks, traffic, assisted conversions, and revenue outcomes. The GEO ledger should contain prompt coverage, mention rate, citation rate, citation share, answer prominence, sentiment, and source concentration. Link records between them at the URL, topic, and intent levels, but don't merge the metrics into one blended score unless stakeholders understand exactly what it hides.
Find the overlap gap
Calculate the share of target prompts where a relevant page ranks strongly in organic search but doesn't appear in the AI answer. That overlap gap is a prioritization list. Inspect those URLs for extractable passages, clear evidence, authoritative outbound references, structured data, and direct answers to the prompt's intent.
Shopper intent changes the interpretation. A product comparison, category question, and post-purchase support query may need different source types and page structures. Teams working on commerce programs can use this guide to shopper intent mapping to build cleaner intent clusters before comparing organic and AI performance.
Track concentration as risk
Citation concentration deserves its own chart. A 2026 analysis of 1,000 AI Overviews found that the top 1% of cited domains captured 47% of all citations, with domain authority showing the strongest correlation with citation inclusion. If your own visibility depends on a small group of pages or domains, a single ranking or technical loss can remove a disproportionate share of AI exposure.
Treat diversification as an insurance metric. Expanding useful citations across topic clusters, page types, and engines may look less impressive than a short-term gain from one authoritative URL, but it gives leadership a clearer view of resilience.
Tools, APIs, and Automation
A developer can build a workable first version with Python and asyncio, n8n, a warehouse, and a dashboard layer. The orchestration workflow sends a frozen prompt panel to the selected engines, records the raw answers, extracts URLs and mentions, then writes normalized observations to a structured table.
Use fields such as:
- Identity:
engine,model,prompt_id,prompt_version,prompt_hash - Classification:
prompt_intent,product_category,is_holdout - Evidence:
cited_url,cited_domain,mention_text,answer_position - Operations:
timestamp,run_id,status,retry_count,extraction_confidence
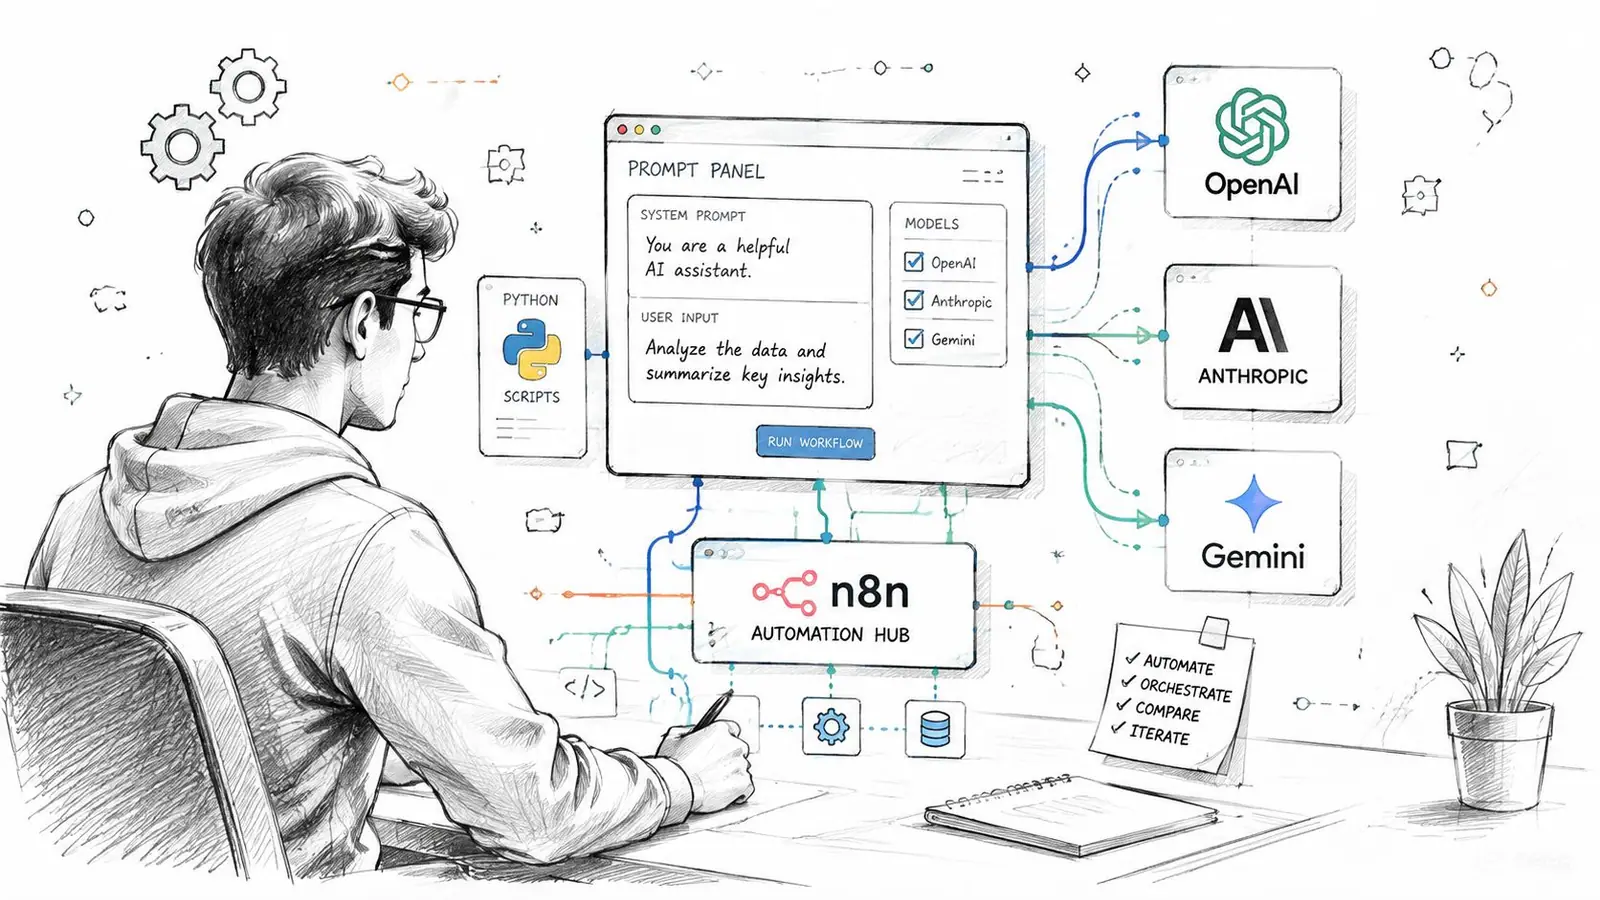
The extraction layer should combine deterministic parsing with reviewable classification. Regex can identify explicit URLs and domains. An LLM-as-judge pass can return JSON for implicit brand mentions, sentiment, source relevance, and answer position, but validate every response and sample outputs for human review. Store the raw answer beside the parsed record so an analyst can reconstruct a disputed result.
Use retries with exponential backoff for transient failures. Put exhausted jobs into a dead-letter queue, and report completed versus attempted samples in the dashboard. Otherwise, a rate limit can lower the denominator and make visibility appear stronger.
For teams assessing the wider category of tooling, NanoPIM's overview of generative engine optimization tools can help frame the differences between monitoring, content analysis, and workflow capabilities.
Surnex is one option for teams that want AI visibility tracking across surfaces such as ChatGPT, Google AI Overviews, Perplexity, and Claude alongside traditional SEO metrics. Whether you use a product or build internally, the audit requirement is the same: preserve the prompt, response, timestamp, extraction output, and calculation logic.
For alerting, compare current citation share with a rolling baseline and use a documented statistical threshold. The alert should link to the affected prompts and raw responses, not just display a red tile. Analysts need evidence they can investigate immediately.
Reporting GEO Results to Stakeholders
GEO programs often fail after the data collection works. Analysts deliver attractive dashboards, executives see fluctuating numbers without context, and content teams receive no clear decision about what to change.
Run two reporting cadences. The weekly operational view should show prompt-panel movement, citation share, mention share, extraction failures, and meaningful changes by engine and intent. The monthly strategic view should connect AI visibility with organic outcomes, assisted conversions, branded demand, and any identifiable LLM-driven visits, while clearly separating correlation from attribution.
| Stakeholder | Primary Metric | Cadence | Decision Unlocked |
|---|---|---|---|
| CMO | AI citation share and risk | Monthly | Continue, expand, or pause investment |
| Growth leader | Prompt coverage and qualified outcomes | Weekly and monthly | Reallocate channel resources |
| Content lead | Citation depth and source gaps | Weekly | Revise or create content |
| Client team | Competitive visibility and evidence | Monthly | Approve priorities and experiments |
Make every slide answer one decision. Put the baseline beside the current value, label uncertainty, identify the prompt and engine scope, and distinguish mentions from citations. If concentration becomes material, show the dependency directly instead of burying it in a notes section.
A useful executive summary can fit into four lines:
- Experiment: What changed, and for which prompt cluster?
- Effect: What moved in citation or mention visibility?
- Confidence: How many repeated observations support the result, and what uncertainty remains?
- Action: What should the team do next, stop, or test?
The audit test is simple. A stakeholder should be able to reconstruct how a number was calculated from the report, stored responses, extraction rules, and denominator. If they can't, the report is a presentation, not a measurement system.
Surnex helps agencies and in-house teams monitor AI visibility, compare citation gaps across emerging AI search surfaces, and connect those findings with traditional SEO reporting. Visit Surnex to see how its dashboards and API can support a repeatable GEO measurement workflow.