You’re probably building reports across too many tabs.
One tab has Google Search Console. Another has GA4. A rank tracker is open somewhere else. Then you take a screenshot of a weird SERP feature, paste it into slides, and try to explain to a client why rankings look stable but clicks feel soft.
That reporting flow used to be messy but manageable. Now it is incomplete.
Modern seo keyword reporting has to explain two realities at once. The first is traditional search performance across queries, pages, and conversions. The second is whether your brand appears inside AI-driven search experiences where people may never click a blue link the way they used to.
Agencies that still send ranking-first reports are not just behind on format. They are behind on what search visibility now means.
Why Your Old SEO Reports Are Failing You
The old report usually does three things. It lists keyword movements, shows traffic trends, and adds a few wins from content published that month.
That format breaks down fast when search behavior shifts but your reporting model does not.
Blue-link rankings no longer explain the full picture
A client can hold position for an important term and still ask why leads feel less predictable. That question is valid. Searchers now encounter AI summaries, alternative answer formats, and brand mentions outside the classic ranking path.
One of the biggest gaps in current industry guidance is that integrating AI search visibility into traditional SEO keyword reporting dashboards remains poorly covered, even as teams need unified metrics for modern search performance. The same gap shows up in user questions, including people asking why their brand does not appear in ChatGPT-driven discovery, as noted by Link Assistant’s analysis of easy-to-rank content gaps.
If your report cannot answer that question, the client has to guess. Clients do not like guessing.
Fragmented reporting creates false confidence
When teams pull rankings from one tool, conversions from another, and AI observations from manual checks, they create a report that looks complete but is not governed by one measurement logic.
That leads to common problems:
- Metrics without context: A ranking gain looks positive until you realize the query lost commercial intent.
- Screenshots without tracking: You show an AI Overview appearance once, but you cannot prove whether it became more or less common over time.
- Traffic without attribution: Organic sessions move, but nobody can explain which keyword groups or AI surfaces contributed.
A report should reduce ambiguity, not package it more neatly.
I’ve found that the strongest reporting systems do not start with charts. They start with a definition of visibility that matches how search works now. If you need a solid reference point for that mindset shift, this piece on creating SEO reports that drive results is useful because it pushes reporting toward decisions rather than dashboard theater.
What is obsolete
A few habits need to go:
- Rank-only success reporting
- Monthly keyword snapshots with no segmentation
- Manual SERP notes that never become a trendline
- Executive summaries that mention impressions but not business impact
The new standard is simpler in principle, even if it takes more discipline to build. Track traditional keyword performance. Track AI visibility. Connect both to conversions, pipeline, and strategic actions.
That is what modern seo keyword reporting has to do if you want the report to retain clients instead of just satisfying a monthly deliverable.
Building Your Reporting Foundation with Smart KPIs
Many reporting problems start before the dashboard exists.
Teams choose metrics because tools make them easy to export, not because those metrics help a client make a decision. That is why so many SEO reports look busy but feel weak in the room.
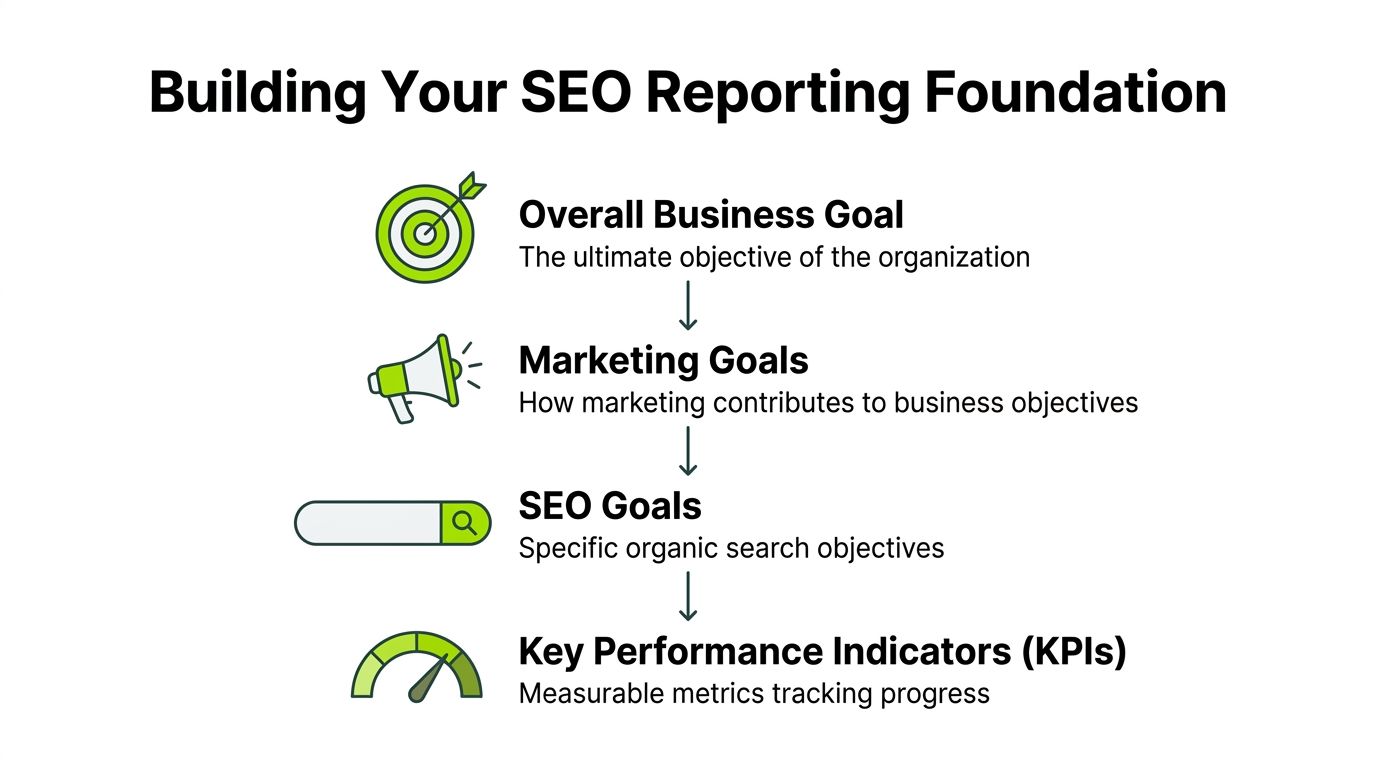
The fix is to build your KPI stack from the business goal down.
Start with business outcomes, not SEO mechanics
A CFO does not care that twelve keywords moved from position eight to five unless that shift changed qualified demand.
A marketing leader does not need more charts. They need to know whether SEO is improving non-branded discovery, supporting revenue pages, and strengthening category ownership.
I build reporting KPIs in four layers:
| Layer | Question it answers |
|---|---|
| Business goal | What commercial outcome matters most right now |
| Marketing goal | How organic search supports that outcome |
| SEO goal | What search behavior must change |
| KPI | What metric proves progress |
That structure keeps reporting honest. It also stops the common drift into vanity metrics.
Stop over-weighting head terms
The biggest reporting mistake I still see is over-investing attention in a tiny set of broad keywords.
That is backwards for most accounts. Over 94% of keywords receive ten or fewer searches per month, and the average keyword length for top-ranking sites is 3.2 to 3.5 words, which is exactly why long-tail reporting matters more than a trophy list of head terms, according to Keyword Everywhere’s SEO stats roundup.
That changes how I define useful KPIs.
Instead of asking, “Did we improve our rankings for the top ten terms?” ask:
- Did non-branded long-tail groups increase their combined clicks?
- Which intent segments are producing conversions?
- Which topic clusters are expanding page-one presence?
- Where are we gaining visibility across queries that buyers use?
A practical KPI stack that works
For most agency accounts, I use a blend of performance, portfolio, and business metrics.
Core operational KPIs
These tell you whether the search program is moving in the right direction.
- Non-branded clicks by topic cluster
- Average CTR by intent segment
- Landing page visibility for core service or product groups
- Share of tracked keyword portfolio in meaningful rank bands
- SERP feature and AI visibility presence
These metrics help the SEO team manage execution.
Client-facing outcome KPIs
These belong higher in the report because they answer the “so what” question faster.
- Conversions from organic landing pages tied to tracked themes
- Qualified traffic by page type
- Performance split between branded and non-branded discovery
- Growth in commercially relevant keyword groups
- Visibility trends for high-value pages
Supporting diagnostics
These stay in the appendix or lower dashboard panels.
Examples include average position, indexed page shifts, and detailed keyword tables. Useful, yes. Primary, no.
The report should show the client what improved, why it improved, and what to do next. Anything else is supporting evidence.
Build segments before you build charts
The cleanest seo keyword reporting setups use fixed segments that do not change every month. If the segmentation changes, the story becomes unstable.
My standard segment set usually includes:
-
Branded vs non-branded This stops brand demand from masking weak category visibility.
-
Intent groups Informational, navigational, and transactional terms should never sit in one blended trendline.
-
Topic clusters Group queries by the problem they represent, not just exact matches.
-
Page type Service pages, product pages, comparison pages, blog articles, and location pages behave differently.
-
Search surface Traditional organic results, SERP features, and AI-driven appearances should be analyzed separately.
If you need a system that supports rank tracking as part of that structure, this workflow is much easier when the rank source fits into the wider reporting model instead of living on its own: https://surnex.io/seo-suite/rank-tracking
What works better than ranking summaries
A useful summary might say:
- Non-branded visibility improved in two service clusters.
- Informational content gained reach, but transactional pages lagged.
- One topic produced stronger conversion quality than its traffic volume suggests.
- AI-era search surfaces are influencing how clicks distribute across the portfolio.
That is stronger than “forty keywords improved.”
Because nobody buys “improved rankings.” They buy more qualified visibility, stronger demand capture, and clearer evidence that SEO is contributing to the business.
Unifying Your Data for a Single Source of Truth
Many reporting disputes are data disputes.
A client sees one number in Search Console, another in GA4, and a third in a third-party platform. The team spends half the call explaining discrepancies instead of discussing strategy.
That is why modern seo keyword reporting needs a clear source hierarchy. Not just more tools.
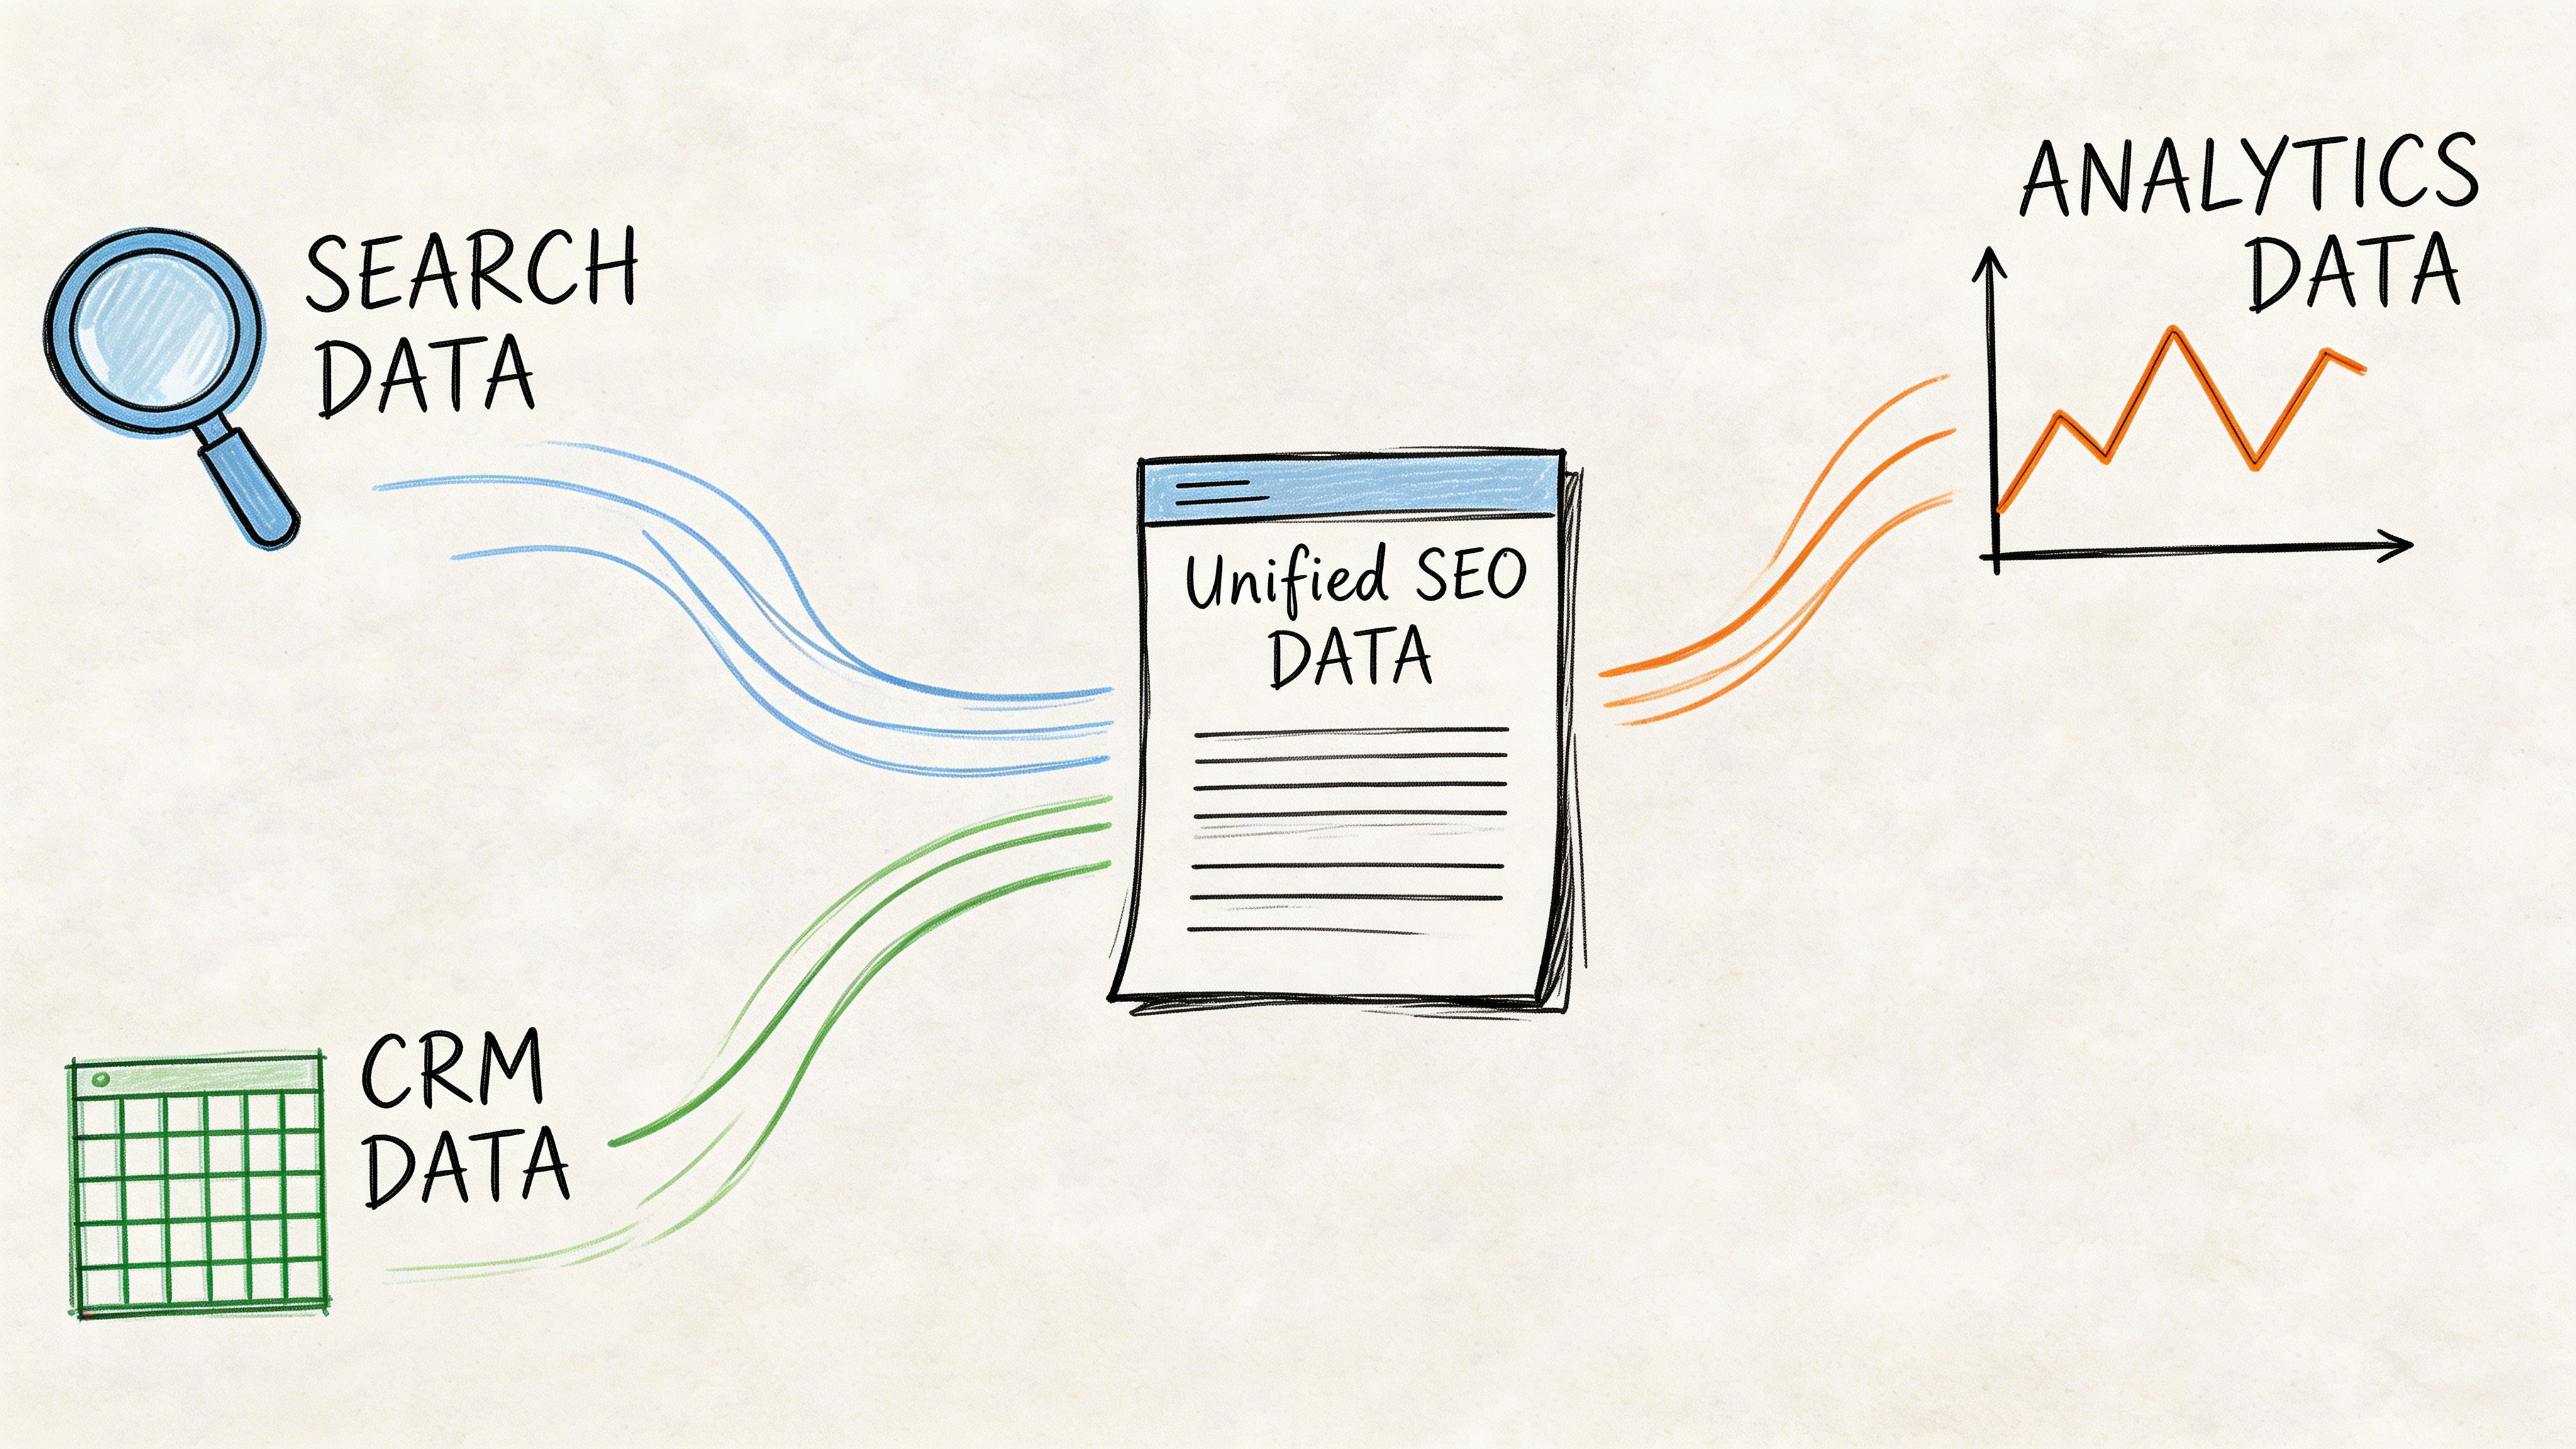
Give each source one job
When teams expect one platform to answer every question, they usually end up with weak attribution and noisy reporting.
I assign roles like this:
| Source | Best use |
|---|---|
| Google Search Console | Query, click, impression, CTR, and average position trends |
| GA4 | Engagement, conversion paths, and landing page outcomes |
| Rank tracking tool | Stable monitoring for target keyword sets and SERP movement |
| Backlink and competitor tools | Context for authority, share shifts, and competitive comparisons |
| AI visibility tracker | Presence in AI Overviews, citation trends, and brand mention gaps |
That split keeps everyone honest. Search Console is not your conversion source. GA4 is not your keyword truth source. A rank tracker is not your complete visibility model.
Handle not provided with a practical method
Here, many reports become unreliable. “Not provided” affects up to 90-95% of organic search referrals, and 62% of agencies report client distrust from unvalidated data, which is why cross-referencing Search Console with third-party data and intent segmentation matters, as outlined by We Are TG’s SEO reporting guidance.
The right response is not to pretend the keyword data is complete. It is to build an attribution method the client can understand.
A practical workflow looks like this:
- Pull raw query-level data from Search Console.
- Pull landing page sessions and conversions from GA4.
- Map keyword groups to landing pages rather than trying to force perfect one-query-to-one-conversion logic.
- Use third-party ranking data to fill directional gaps for tracked terms.
- Validate patterns against page intent and business outcomes.
That gets you much closer to decision-grade reporting.
If a metric cannot be explained in plain language, it should not sit in the executive summary.
Add AI visibility as a first-class dataset
Many teams still bolt this part on manually.
They run a few prompts, capture screenshots, and discuss them as observations. That is useful for audits. It is weak for recurring reporting.
AI visibility should be treated like any other reporting layer:
- Track appearance presence across priority prompts and query themes
- Monitor brand citations over time
- Identify citation gaps where competitors appear and you do not
- Map AI mentions back to pages, topics, and authority signals
- Compare AI visibility with traditional ranking performance
When this sits in the same environment as traditional SEO data, the client can finally see whether search demand is shifting away from classic click paths.
For teams trying to reduce tool sprawl, a platform like Surnex can combine domain-level SEO metrics with newer AI visibility tracking in one workflow. This matters most when you want one dashboard instead of a separate SEO stack and AI observation process. Domain-level context is the backbone, and this kind of view is the reason teams look for tools that consolidate visibility analysis: https://surnex.io/seo-suite/domain-overview
Build trust with a source hierarchy slide
One simple thing works well in client reporting. Add a small panel that states where each metric comes from.
For example:
- Search Console for query visibility
- GA4 for engagement and conversions
- Rank tracker for monitored target terms
- AI tracker for AI Overview and LLM presence
That single clarification cuts down on avoidable debates.
When clients understand the data architecture, they stop asking why every platform shows a slightly different count and start asking the right question, which is what the combined view means for the business.
Designing Client-Ready Dashboards That Tell a Story
A strong dashboard does not try to show everything. It arranges information so the client can understand the account in minutes, then spend the rest of the meeting on decisions.
Many weak dashboards fail for one reason. They are designed for the SEO team that built them, not for the person who has to approve budget, defend performance internally, or decide priorities.
The dashboard should read like a business review
The best layout I’ve used follows the same logic every month.
Panel one shows the executive summary
This area should answer four questions immediately:
- What changed
- Why it changed
- Whether it matters
- What needs attention next
Keep this brief. Two or three concise observations usually work better than a paragraph full of caveats.
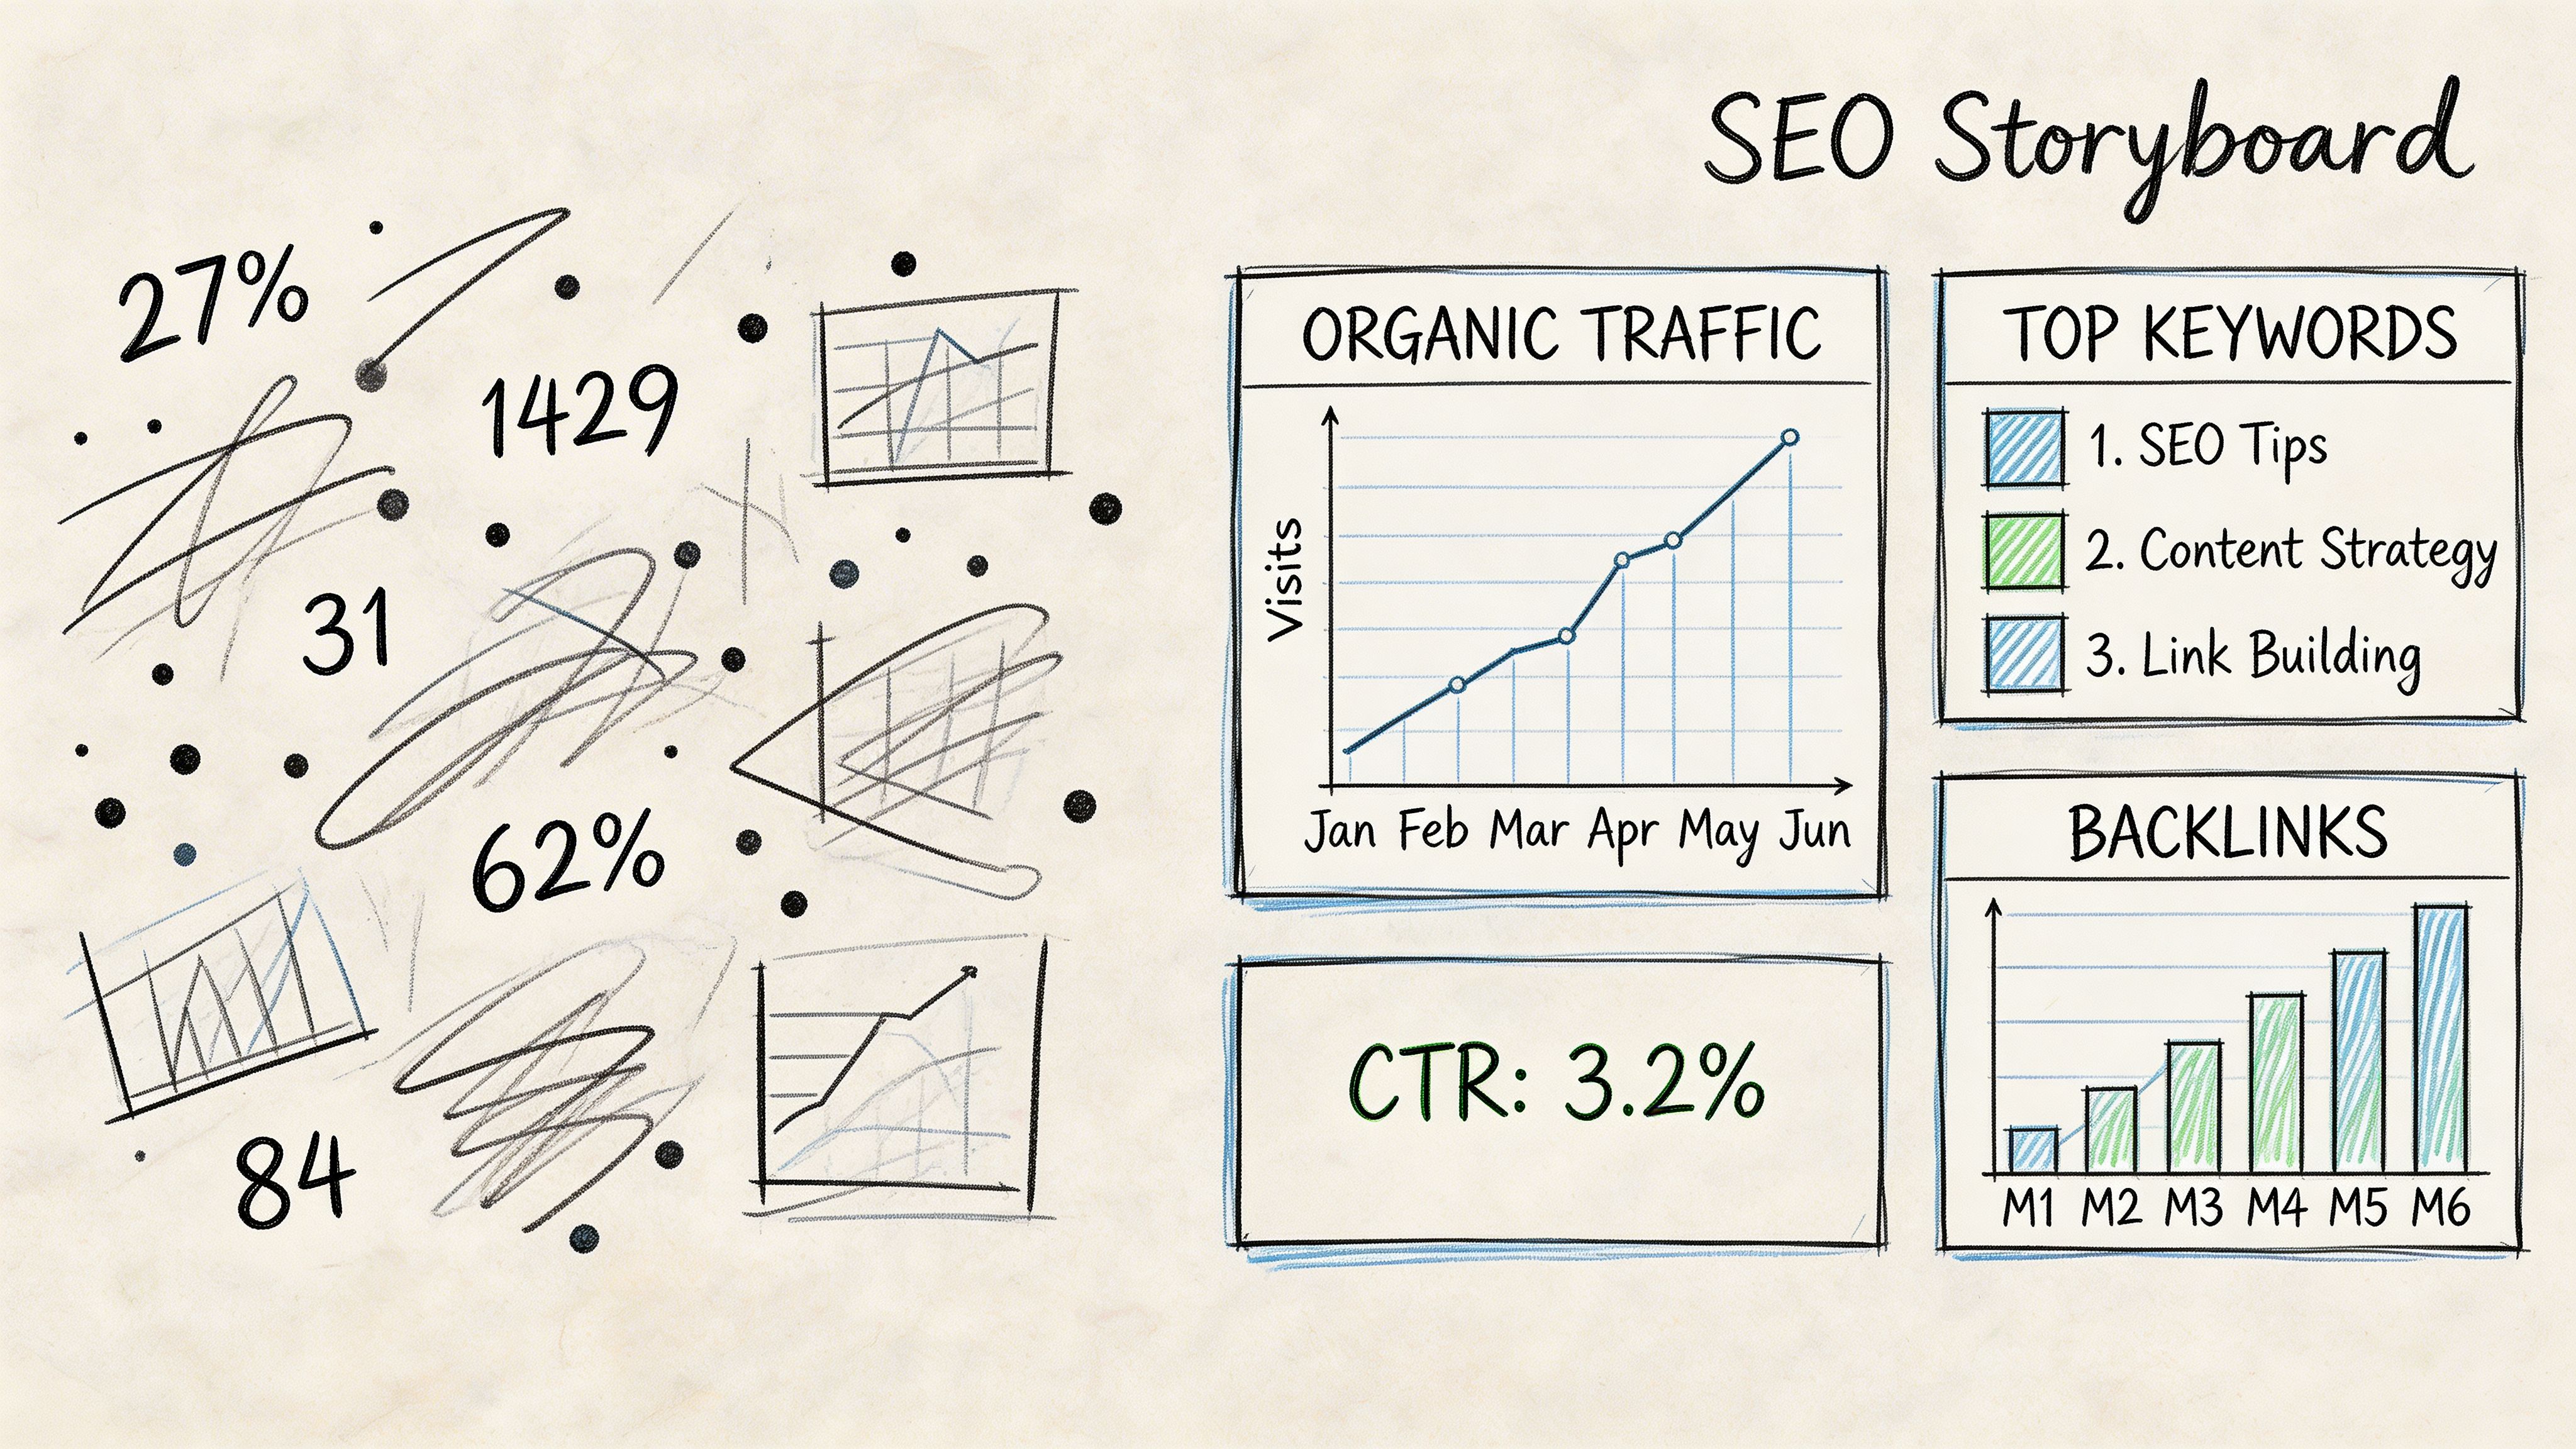
Panel two shows trendlines that matter
Panel two shows trendlines that matter, and a common mistake is for teams to show too many lines.
A client-ready dashboard usually needs a small set of trends such as:
- non-branded organic visibility
- qualified organic traffic by page group
- conversions from SEO landing pages
- AI visibility presence for core themes
You are not hiding detail. You are sequencing it.
Panel three explains the split behind the headline
Once the top-line trend is clear, show the segmentation that explains it.
Useful breakdowns include:
| Breakdown | Why it matters |
|---|---|
| Branded vs non-branded | Separates real category growth from existing brand demand |
| Intent group | Shows whether traffic quality is improving |
| Topic cluster | Connects content strategy to performance |
| Page type | Reveals where site architecture is helping or limiting outcomes |
| AI visibility module | Captures emerging discovery patterns |
A simple reporting narrative clients follow easily
A dashboard should make a clear sequence possible.
Start with the account-level movement. Then show which keyword groups created it. Then point to the pages involved. Then explain the business implication.
That flow turns reporting from a data dump into a strategic conversation.
Consider this approach:
-
State the change “Non-branded visibility improved in commercial service themes.”
-
Explain the driver “Updated service pages and stronger internal linking expanded visibility across long-tail variants.”
-
Show the business relevance “That traffic reached pages with stronger conversion intent than the blog section.”
-
Recommend the next move “Extend the winning structure to the remaining service cluster and close AI citation gaps for the same topic.”
That is a story. Clients remember stories.
Add a dedicated AI search visibility module
This module should not sit in a notes field. It deserves a visible place in the dashboard.
Show:
- presence by tracked prompt or query theme
- whether the brand is cited, summarized, or absent
- competing domains that appear more often
- content or entity gaps tied to those missing appearances
A lot of teams still treat this as experimental. Clients do not. They are already asking about it.
For teams building recurring client deliverables, it helps to use a reporting workflow designed for explanation, not just export. This is the difference between a dashboard your team can decode and one a client can use in a meeting: https://surnex.io/workflows/client-ready-reporting
A short walkthrough can also help align internal stakeholders on what a good reporting narrative looks like:
What to remove from the dashboard
Some elements create noise faster than value:
- Massive keyword tables near the top
- Standalone average position widgets
- Screenshot galleries with no trendline
- Unfiltered sitewide traffic graphs
- Charts that combine branded, non-branded, and mixed intent
A dashboard is not the archive. It is the decision surface.
Keep the details available, but do not lead with them. When the dashboard tells a coherent story, the meeting changes. You spend less time translating charts and more time agreeing on what to do next.
Automating Your Reporting for Speed and Scale
Manual reporting is expensive even when nobody labels it that way.
It burns strategist time, creates version-control problems, and turns reporting day into an exercise in copying data between systems. The true cost is not just hours. It is delay. By the time the report is assembled, the search environment may already have changed.
That matters more now because AI Overviews appear in 7.6% of Google searches, 19% of results contain AI-generated content as of 2025, and click-through rates may be reduced by 10-15%, which makes automated reporting critical in a more volatile SERP environment, according to SEO Sherpa’s SEO statistics page.
Automation fixes three agency bottlenecks
The first bottleneck is data collection. The second is recurring formatting. The third is delayed reaction.
Automation improves all three.
Pull data on a schedule
Use APIs where possible. Search Console exports, rank tracking pulls, backlink changes, and AI visibility checks should feed a warehouse, dashboard layer, or reporting environment without manual intervention.
If your team still downloads CSV files each month, you are using strategist time for clerical work.
Standardize report logic
Templates matter, but logic matters more.
Your dashboard should calculate the same segments the same way every period. That includes branded rules, keyword groups, page classifications, and AI visibility labels. Automation helps because it reduces human inconsistency.
Trigger alerts before the monthly call
The strongest reporting setups do not wait for the report to reveal a problem.
Set alerts for things like:
- a priority landing page losing visibility
- a tracked keyword cluster dropping across multiple pages
- a competitor appearing more often in AI results for a core topic
- a mismatch where impressions rise but commercial page engagement weakens
This changes reporting from historical commentary to operational management.
What should stay manual
Not everything should be automated.
Keep human review in three places:
| Keep human input for | Why |
|---|---|
| Narrative summary | Clients need interpretation, not just exported charts |
| Anomaly review | Some changes are tracking noise, site changes, or seasonality |
| Action prioritization | The right next move depends on resources and business context |
Automation should remove repetitive assembly work. It should not replace strategic judgment.
The goal is not fully automated SEO thinking. The goal is fully automated SEO plumbing.
The practical payoff
When reporting is automated properly, the team spends less time preparing slides and more time checking whether the story still holds. That leads to better calls, faster responses to SERP shifts, and fewer awkward moments where a client spots something in search before you do.
For agencies managing multiple accounts, that difference compounds quickly. The reporting system stops being a monthly burden and becomes an always-on visibility layer.
That is the primary advantage. Speed, yes. But also control.
Interpreting Results to Drive Action and Prove Value
A report earns its keep when it changes what the team does next.
Too many SEO reviews stop at description. Traffic up. Rankings mixed. Some pages improved. A few slipped. That is not interpretation. That is inventory.
Useful seo keyword reporting connects movement to cause, then to action.
Read changes in groups, not in isolation
One metric almost never tells the full story.
If impressions drop but CTR rises, do not panic. You may have lost low-intent visibility while retaining stronger query alignment. If rankings hold but conversions soften, the issue might be page experience, intent mismatch, or a shift in how users discover answers before clicking.
I prefer reading results across three layers:
-
Visibility movement What changed in search exposure
-
Page and intent context Which pages and query types drove that change
-
Business outcome Whether conversion quality improved, weakened, or stayed flat
That sequence keeps the team from making cosmetic fixes to a strategic problem.
Use topical authority to interpret wins and losses
This is one of the most reliable ways to move beyond shallow keyword commentary. Advanced reporting that maps keywords to topical authority yields 2.5x higher domain visibility, and agencies using this approach see 35% faster client approval cycles while avoiding cannibalization issues that affect 35% of enterprise sites, according to Alps AI’s discussion of keyword research mistakes and reporting implications.
That matters because isolated keyword wins can hide structural weakness.
A page may rank for one target term, but if the surrounding topic cluster is thin, the gain will be fragile. Another common issue is cannibalization, where multiple pages compete for the same theme and dilute clarity.
A better interpretation model asks:
- Are we gaining authority across the topic, or only one term?
- Do multiple pages compete for the same intent?
- Is the winning page the one most likely to convert?
- Are backlinks and page authority aligned with the terms we want to own?
When the answer to that last question is no, off-page signals often need attention alongside content and internal linking. That is where backlink context becomes part of the reporting discussion rather than a separate SEO workstream: https://surnex.io/seo-suite/backlinks
Turn findings into a next-quarter roadmap
The client meeting should end with prioritized action, not a recap of charts.
A practical close usually includes:
-
Protect what is working Reinforce pages and clusters already earning qualified visibility.
-
Fix structural conflicts Resolve cannibalization, intent mismatch, and weak internal linking.
-
Expand proven topics If one cluster is gaining traction, build adjacent content and supporting page depth.
-
Respond to AI visibility gaps Where competitors appear in AI-driven answers and your brand does not, tighten topical coverage and entity clarity.
Strong reporting proves value by making the next decision easier.
Clients rarely need more data. They need confidence that the data points to a sensible plan. When you can explain not just what changed, but what the business should do next, the report becomes a retention tool instead of a reporting obligation.
Frequently Asked Questions About Modern Reporting
What should be on page one of an SEO report
Keep it tight. Include the clearest business-facing outcomes, a short narrative on what changed, and the main risks or opportunities. If page one is dominated by keyword tables, the report is upside down.
How often should AI visibility be reviewed
For priority topics, review it on a recurring cadence alongside traditional search metrics. Monthly reporting is fine for executive review, but operational monitoring should happen more frequently when the account depends on search-driven demand.
Should clients still see ranking data
Yes, but not as the hero metric. Rankings are diagnostic. They help explain movement. They do not prove business impact on their own.
How do you explain “not provided” without sounding evasive
Be direct. Explain that keyword-level referral visibility is limited, then show how Search Console, landing page performance, and tracked query groups are used together. Clients usually accept complexity when the method is transparent.
What is the simplest way to explain modern SEO reporting to non-SEOs
Frame it as visibility reporting, not just ranking reporting. You are measuring how often the brand appears, where it appears, what type of demand it captures, and whether that visibility contributes to business outcomes. If you need a plain-language resource to share with newer stakeholders, What Is SEO Reporting is a helpful baseline explainer.
What is the biggest reporting mistake agencies still make
Reporting activity instead of outcomes. Publishing content, fixing tags, and improving positions are useful updates. They are not the end result the client is buying.
If your team needs one place to track traditional rankings, AI search visibility, citation gaps, and reporting workflows without bouncing between disconnected tools, Surnex is built for that modern search view. It gives agencies and in-house teams a unified way to monitor how brands surface across classic SEO and emerging AI discovery so reporting becomes clearer, faster, and easier to act on.