Most advice about search engine marketing reports is backwards.
It tells you to start with dashboards, templates, and platform exports. That's how agencies end up sending polished data dumps that nobody uses. Clients don't need more charts. They need a report that explains what changed, why it matters, what to do next, and how search behavior is shifting as AI surfaces become part of discovery.
That old reporting model is under pressure for another reason. Traditional SEM reports were built for clicks, sessions, and ad platform metrics. They weren't built for a search environment where AI answers can influence trust, shortlist creation, and buying momentum before a user ever lands on a site. If your report only covers Google Ads, Search Console, and traffic totals, you're missing part of the story.
Strong search engine marketing reports still cover the basics. They track outcomes, diagnose problems, and guide budget decisions. But in 2026, they also need to connect standard SEO and PPC reporting with AI visibility, citation presence, and multi-touch journeys across channels.
Start with Why Defining Report Objectives and Audience
Great reports start with questions, not data.
If a client asks for “a monthly SEM report,” that request is too vague to be useful. A CMO wants evidence that search is contributing to acquisition efficiency or market share goals. A sales leader wants to know whether lead quality is improving. A channel manager wants to know which campaigns need action this week. If you give all three people the same report, at least two of them will ignore it.
Search reporting has to stay tied to business context because search itself operates at massive scale. Google holds nearly 90% of the global search market, and there are more than 8.5 billion searches per day globally, according to Clutch's 2025 search statistics roundup. That's why good reporting focuses on strategic impact, not isolated keyword wins.

Ask stakeholders better questions
Most reporting problems begin before the first metric is chosen. The account team never clarified what decisions the report should support.
Use stakeholder interviews that force specificity:
-
What decision should this report help you make? Budget shift, campaign pause, landing page change, market expansion, sales alignment.
-
What would make this report feel successful to you? Faster executive review, fewer ad hoc questions, clearer attribution, better pacing decisions.
-
What do you distrust in current reporting? Blended channels, weak lead quality definitions, overreliance on last-click views.
-
What's your acceptable level of detail? Some clients want one page and three recommendations. Others want segment-level drilldowns.
Practical rule: If the report doesn't support a decision, it's just documentation.
Build different reports for different jobs
There isn't one ideal SEM report. There are different report types with different jobs.
| Report type | Primary audience | Main purpose |
|---|---|---|
| Strategic | CMO, founder, VP Marketing | Connect search to growth, efficiency, and market position |
| Operational | Marketing manager, demand gen lead | Track channel health, pacing, and conversion performance |
| Tactical | SEO lead, PPC specialist, analyst | Diagnose keyword, audience, ad, and landing page issues |
The mistake is trying to combine all three into one monster dashboard.
A cleaner model is to create a short executive summary, a working dashboard for the channel team, and a deeper appendix or live view for analysts. Agencies that serve multiple accounts often benefit from a standard workflow for this. A platform built for marketing agency reporting operations can help centralize how those layers are produced, but the core issue is still strategic clarity, not software.
Tie objectives to business outcomes
A report objective should read like this: “Show whether non-brand search is producing qualified pipeline efficiently,” not “track rankings and traffic.”
That shift changes everything. It changes which metrics matter, which segments need separate analysis, and how recommendations are written. It also prevents the common agency habit of sending every available metric just because the connectors work.
Choosing Your Must-Have SEM Metrics
The easiest way to ruin search engine marketing reports is to lead with metrics that are easy to pull instead of metrics that explain performance.
Clicks, impressions, average position, and spend all have value. But they don't belong at the top unless the client's goal is pure visibility. For most accounts, the top layer should focus on business outcomes. The lower layers should diagnose why those outcomes moved.
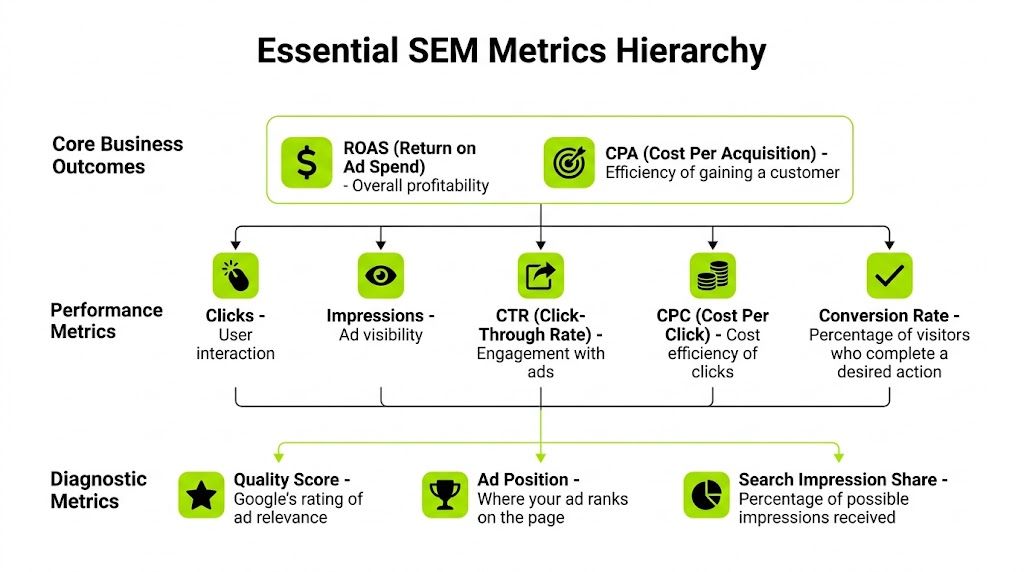
Use a metric hierarchy
A simple hierarchy keeps reports readable:
-
Business outcomes ROAS, CPA, qualified lead volume, assisted conversions, customer value indicators.
-
Performance metrics Conversion rate, CTR, CPC, impression share, landing page engagement, cost by campaign or keyword cluster.
-
Diagnostic metrics Search term quality, ad relevance signals, device splits, audience splits, page-level issues, auction pressure.
This isn't just a formatting choice. It keeps teams from reacting to surface-level movement without checking whether the business result changed.
If you want a good primer on structuring metrics around decision-making instead of vanity reporting, Querio's piece on understanding KPI reporting is useful because it frames KPIs as management tools, not reporting filler.
Segment before you summarize
One of the biggest reporting failures is blending brand and non-brand keyword performance. Brand terms can make a weak program look healthy because they usually convert differently and carry different intent. Search Engine Journal notes that effective reporting should separate those segments and map them to their own conversion paths and KPIs in its piece on enterprise SEO reporting mistakes.
That principle applies beyond keywords.
Break performance apart by:
-
Brand vs. non-brand Brand shows demand capture. Non-brand shows competitive visibility and new demand creation.
-
New vs. returning users Helpful when remarketing, branded search, and organic discovery overlap.
-
High-intent vs. research-stage queries Don't compare “buy” terms with informational terms as if they serve the same job.
-
Device and geography Useful when conversion paths differ sharply across local markets or mobile-heavy traffic.
Reports should make hidden differences visible. Aggregates do the opposite.
Track SEO and PPC together when intent overlaps
Many agencies still split their thinking. Paid and organic often target the same problem space, but reports treat them as separate universes.
That creates blind spots:
- You may be paying for clicks on terms where organic visibility is already strong and incremental value is low.
- You may see branded organic growth that's partly supported by paid awareness.
- You may miss opportunities where PPC data exposes strong intent before SEO gains traction.
A better report groups search by keyword cluster or topic, then shows both paid and organic presence against the same business outcome. That makes budget conversations sharper. Instead of debating channel ownership, you can ask whether the total search footprint is producing profitable demand.
Keep some metrics out of the main report
Not everything deserves front-page status.
Raw ranking snapshots, broad traffic totals, and isolated impression gains often distract more than they help. They belong in supporting views unless they connect directly to performance changes or strategic objectives. A senior client rarely needs more data. They need less noise.
Reporting on AI and The Future of Search
Traditional SEM reporting has a blind spot, and it's getting harder to ignore.
A user can now discover a brand through Google's AI-generated search experiences or through an LLM-driven answer without producing the kind of click trail agencies are used to reporting. That doesn't mean the interaction had no value. It means the reporting model is incomplete.
Current frameworks are failing to measure brand impact in these environments. The gap is clear in this analysis of search marketing reporting and AI visibility, which argues that agencies still lack usable ways to report on Share of Voice in AI answers and source attribution in LLM citations.
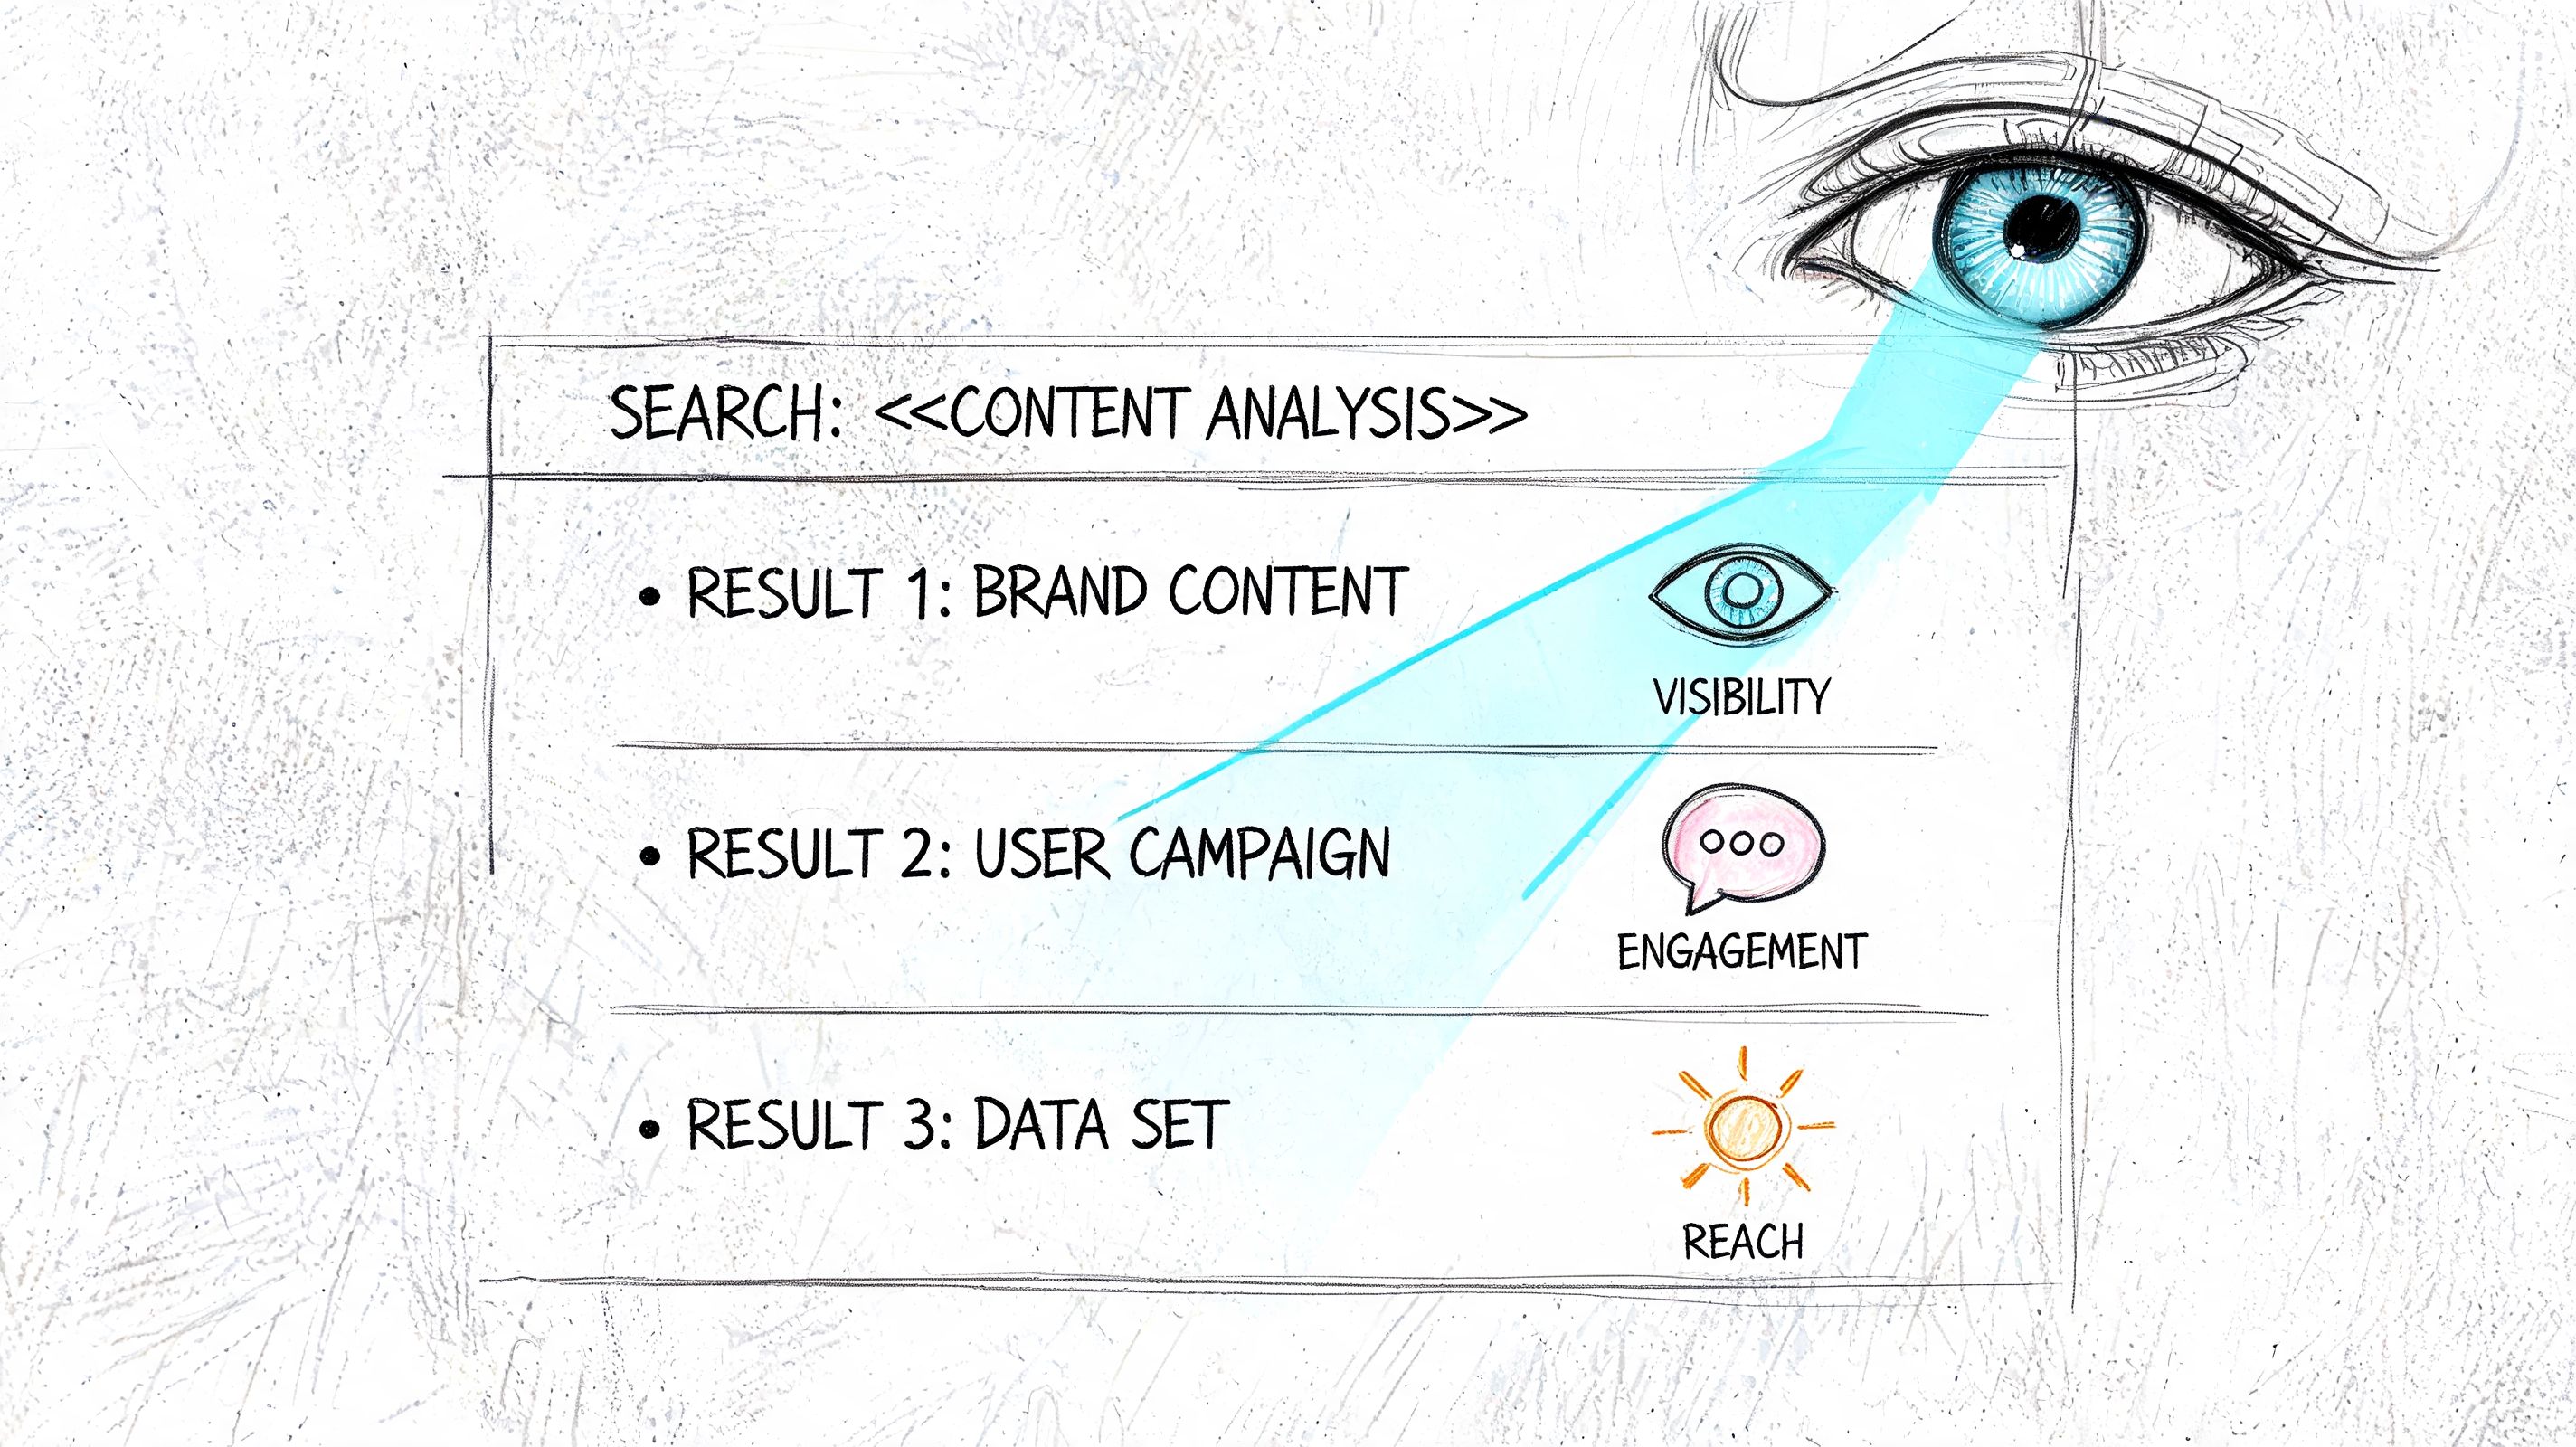
What AI visibility actually means
The phrase is often used loosely. It helps to define it in reportable terms.
For agency reporting, AI visibility usually means some combination of:
-
Presence in AI answers Whether the brand appears in generated summaries or recommendation-style responses.
-
Citation frequency How often the brand's site or content is referenced as a source.
-
Comparative visibility Whether competitors appear more often for the same prompt sets or query themes.
-
Brand framing The context in which the brand is described, compared, or recommended.
These aren't perfect metrics yet. That's the point. Search has changed faster than reporting standards have.
Add an AI reporting layer to your existing SEM framework
Agencies don't need to throw away their current SEO and PPC reports. They need to extend them.
A practical reporting layer can include:
| AI reporting element | What to capture | Why it matters |
|---|---|---|
| AI answer presence | Brand mentioned or absent | Measures visibility beyond the click |
| Source citation | Your domain cited or not cited | Shows whether content is influencing AI answers |
| Competitor comparison | Which brands are surfaced together | Helps explain category positioning |
| Query theme coverage | Prompts by topic or intent cluster | Connects AI visibility to search strategy |
This is also where modern tools become necessary. Teams need a way to watch how brands surface across AI-driven discovery and fold that into broader search analysis. For agencies that want this in the same workflow as standard SEO data, AI search trend monitoring gives one example of how those visibility shifts can be tracked alongside familiar search signals.
A client doesn't care whether visibility came from ten blue links or an AI answer. They care whether buyers are finding the brand.
Report influence, not just traffic
The old SEM reporting mindset asked, “Did it click?”
The newer question is, “Did this search presence influence the buying journey?”
That changes how recommendations are framed. If a brand appears in AI answers but isn't cited as a source, content clarity and authority may need work. If a competitor is consistently surfaced in recommendation prompts, that's a strategic visibility problem even if paid campaigns still look stable.
The agencies that handle this well don't pretend attribution is solved. They explain the uncertainty directly, add directional AI visibility metrics, and tie them back to downstream outcomes like branded search trends, lead quality, and conversion paths.
Designing Dashboards That Communicate Clearly
A dashboard fails when the client has to ask where to look first.
Most SEM dashboards are too dense, too flat, or too eager to show everything. The result is predictable. The client scans the top row, misses the story, and asks for a meeting to explain what the dashboard should have made obvious in the first place.
Start with one question: what should this person understand within a few seconds?
Design for the decision, not the dataset
A client reviewing ROAS doesn't need a wall of tables above the answer. Put the decision-driving numbers first. Put diagnostics second. Put exports and raw detail last.
That usually means a dashboard should have:
-
A top summary row Outcome KPIs only. No clutter.
-
A middle analysis layer Trends, segment splits, channel contribution, pacing.
-
A lower diagnostic layer Search terms, campaign detail, landing page issues, device or audience views.
This sounds basic, but many agencies still lead with platform-native widgets that were never designed for client communication.
Use layout to create hierarchy
Whitespace does part of the work. So does restraint.
If everything is bold, nothing stands out. If every chart uses a different color palette, the reader has to relearn the dashboard section by section. A cleaner layout makes the narrative faster to absorb.
A few practical rules help:
-
Keep comparison logic consistent Don't show one chart month-over-month and the next as an arbitrary date range unless there's a reason.
-
Use color sparingly Reserve strong color for status shifts, important deltas, or callouts.
-
Name charts like decisions “Non-brand CPA by campaign” is better than “Campaign performance.”
A good companion read here is Keywordme's take on PPC report structure and presentation, especially for teams trying to make paid search reporting easier for non-specialists to interpret.
Build role-specific views
One dashboard should not try to satisfy every audience. Executive dashboards should be narrow and high signal. Working dashboards can go deeper.
A clean split often looks like this:
| Dashboard view | What it shows |
|---|---|
| Executive | Outcome KPIs, major changes, key risks, next actions |
| Channel manager | Campaign trends, segment performance, pacing, cost efficiency |
| Analyst | Search terms, device splits, audience behavior, page-level detail |
For teams building in Looker Studio or similar tools, the right tutorial can speed up the visual side of this work:
When agencies need to combine traditional SEO views with newer search changes, broader SEO trend reporting workflows can also help frame what belongs in the executive layer versus the analyst layer.
From Data to Decisions with Narrative and Cadence
A report without narrative is a spreadsheet with branding.
Clients don't hire agencies to forward exports from ad platforms. They hire agencies to interpret evidence and recommend action. That means every report needs a point of view. Not spin. Not overconfidence. Just a clear explanation of what happened, why it likely happened, and what should happen next.
One of the biggest weaknesses in search engine marketing reports is the failure to show the full customer journey. The often-overlooked Google Analytics Multi-Channel Funnels report helps reveal how sources work together before conversion, which matters even more as AI-assisted discovery enters the path, as discussed in this piece on underused Google Analytics reports.
A useful report story has three parts
The strongest reporting cadence usually follows a simple narrative model.
First, give context. What was the goal, what changed in the market or account, and what period is being compared?
Then show results with interpretation. Don't just say non-brand conversions fell. Say whether the drop came from weaker landing page conversion, rising CPC pressure, lower impression share, or a shift in traffic mix.
Finally, give next actions. If there's no recommendation, the client has to do the strategist's work themselves.
“Traffic increased” is not a useful update. “Traffic increased, but the gain came from low-intent queries and didn't improve qualified lead flow” is useful.
Match cadence to the decision cycle
Not every report should be monthly, and not every stakeholder should receive the same frequency.
A practical cadence often looks like this:
-
Daily or flash updates For spend pacing, tracking issues, outages, or major campaign changes.
-
Weekly summaries For channel managers who need to adjust bids, budgets, audiences, and creative.
-
Monthly reports For most clients. Enough time to evaluate movement without reacting to noise.
-
Quarterly business reviews For broader attribution, trend analysis, budget allocation, and channel strategy.
Monthly reports answer “what changed?” Quarterly reviews answer “what are we learning?”
Show uncertainty honestly
Attribution across organic search, paid search, direct visits, and AI-influenced discovery is messy. Pretending otherwise hurts credibility.
A better narrative sounds like this: paid search likely captured lower-funnel demand, organic supported research behavior, and AI visibility may have contributed to early-stage consideration that doesn't show cleanly in analytics yet. That's honest, useful, and far more mature than a forced last-click story.
Automating Reports and Agency Best Practices
Manual reporting breaks first at the agency level.
It works for a few accounts. Then the account load grows, reporting dates pile up, and analysts start copying numbers into templates under deadline pressure. That's when inconsistencies show up, commentary gets thin, and client trust starts slipping.
Automation fixes the repetitive parts, not the thinking. The goal is to automate collection, validation prompts, dashboard refreshes, and formatting so strategists can spend time on analysis.
Build one source of truth
If Google Ads, GA4, Search Console, CRM data, and AI visibility monitoring all sit in separate files owned by different people, reporting drift is inevitable.
A better setup usually includes:
- Centralized connectors or API pulls into a reporting layer.
- Clear metric definitions so “conversion,” “qualified lead,” and “assisted revenue” don't change by account manager.
- Template logic for standard views across clients.
- Review checkpoints before anything is sent externally.
The most common technical reporting error is confusing activity with outcomes. Teams need validated conversion tracking and regular review of KPIs like CPA and ROAS, then they need to adjust based on those signals rather than traffic swings alone, as outlined in this guidance on common SEM mistakes.
Automate the pipeline, not the judgment
Use APIs and native connectors where possible. Pull campaign data automatically. Refresh dashboards on schedule. Standardize annotations for launches, site changes, and budget shifts.
But don't automate the narrative. Clients can tell when commentary is boilerplate.
This is also where a workflow product can be useful if it reduces handoffs between data collection and client delivery. For example, a system for client-ready reporting workflows can help agencies assemble repeatable reports from live search data, but the report still needs a human to explain trade-offs and priorities.
Agency SEM Report Pre-Flight Checklist
Before any report goes out, run a quality check.
| Check | Item | Why It Matters |
|---|---|---|
| Yes or No | Date range verified | Prevents wrong-period comparisons and false alarms |
| Yes or No | Brand and non-brand separated where relevant | Stops brand demand from masking weaker generic performance |
| Yes or No | Conversion tracking validated | Protects against reporting on broken goals or duplicate events |
| Yes or No | Outcome KPIs placed above activity metrics | Keeps the report focused on business results |
| Yes or No | Notes added for launches or external changes | Gives context for unusual movement |
| Yes or No | AI visibility section included when relevant | Reflects modern search behavior beyond clicks |
| Yes or No | Recommendations included | Turns reporting into action |
| Yes or No | Executive summary written in plain language | Makes the report usable outside the channel team |
| Yes or No | Dashboard filters and views tested | Prevents client-facing errors in shared links |
| Yes or No | Numbers reconciled across sources | Reduces trust-damaging discrepancies |
Final check: If the client read only the first screen and the recommendation section, would they still understand what to do next?
That standard is harder to meet than most agencies admit. It's also the difference between reports that get skimmed and reports that shape budget decisions.
If your team needs a cleaner way to connect SEO, PPC, and AI visibility into one reporting workflow, Surnex is built for that use case. It combines traditional search signals with AI search visibility tracking, including areas like AI Overviews and LLM-driven discovery, so agencies and in-house teams can produce reports that explain not just traffic and rankings, but how brands are appearing across modern search experiences.