You open Google Analytics, GA4, Adobe Analytics, or whatever stack your team uses and see a decent month. Traffic is up. A few landing pages improved. Branded search looks healthy. The problem is simple: you still don't know if you're winning.
A lift inside your own dashboard can hide a loss in the market. Your category leader may be taking more non-brand demand. A smaller rival may be stealing high-intent searches with sharper landing pages. Another competitor may be showing up inside AI answers while your team celebrates a small rank gain in classic search.
That gap is where compete web analytics matters. It isn't just website reporting. It's the discipline of measuring your performance in context, against the sites, pages, channels, and now AI search surfaces that shape buyer discovery.
Web analytics itself became formalized in the late 1990s and early 2000s, then shifted into mainstream business use when platforms turned server logs into usable marketing data. A major milestone came when Google launched Google Analytics in November 2005 after acquiring Urchin in 2005, which made broad website measurement accessible at no direct software cost and pushed teams beyond vanity metrics toward KPIs tied to search clickthrough rate, keyword visits, and page engagement, as outlined in Digital.gov's introduction to analytics. That changed how teams worked. It also created a blind spot. Most organizations got much better at measuring themselves than measuring the field around them.
Beyond Your Own Dashboard
A familiar scenario plays out in almost every agency review. The client sees growth in organic sessions and asks whether the SEO program is working. The honest answer is often, "Partly, but we need market context."
If your top category pages gained traffic while the rest of the market surged faster, your position may have weakened. If your branded traffic rose while competitor comparison pages lost visibility, that could be a defensive win. The numbers alone don't tell you that. Context does.
Why internal analytics isn't enough
First-party analytics tools are strong at telling you what happened on your site. They show page performance, conversion paths, and where users drop off. They don't show what happened on competitor sites, which search terms competitors captured, or whether your category is shifting toward a new discovery pattern.
That matters because buyers don't compare your current month to your last month. They compare your brand to alternatives.
Practical rule: A dashboard without competitor context is operational reporting, not competitive intelligence.
The shift from reporting to decision-making
As analytics matured, teams started using landing-page behavior, search terms, and exit-page patterns to make better decisions. That was a significant breakthrough. Analytics stopped being traffic counting and became a way to diagnose why content, CTAs, and search intent were connecting or failing to connect.
For competitive work, the same principle applies. You don't just ask, "How many visits did we get?" You ask:
- Where are competitors attracting demand
- Which topics are bringing users in first
- Which pages appear to hold attention
- Where might buyers be dropping off or switching brands
That change in mindset is the foundation of compete web analytics. You're no longer staring at your own speedometer. You're reading the whole track.
What Is Competitive Web Analytics
Competitive web analytics is the practice of estimating and comparing how websites compete for attention, traffic, engagement, and visibility across search and discovery channels. It combines your own hard data with outside signals from panels, crawlers, SERPs, referral patterns, and now AI answer surfaces.
A good way to think about it is racing. Your analytics platform tells you your speed, your lap time, and whether your engine is healthy. Competitive analytics tells you where the other cars are, who is overtaking on corners, and which line is winning the race.
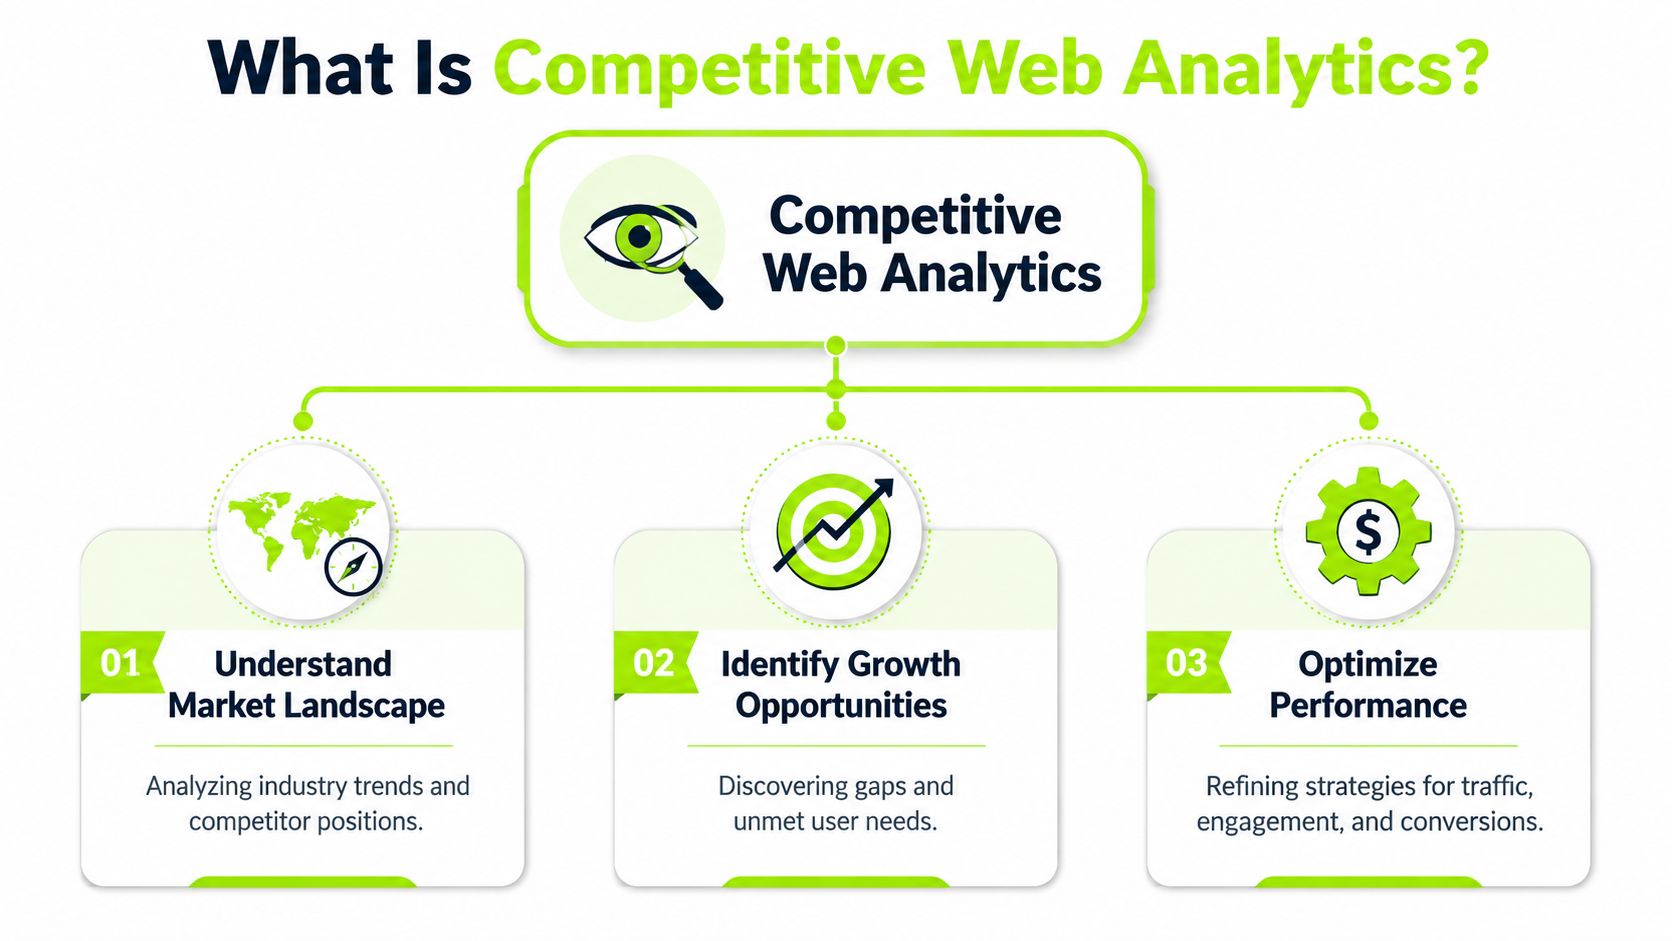
Three pillars that matter
Understand market landscape
This is the broad view. Which domains dominate your category. Which subtopics they own. Which channels appear to drive their visibility. Which audiences they target. Without this, teams mistake isolated wins for market strength.
This is also where modern AI competitor intelligence becomes useful. Traditional competitor monitoring focused on rankings, backlinks, and ad visibility. AI-era monitoring adds a new layer: who gets surfaced, cited, and repeated in machine-generated answers.
Identify growth opportunities
Organizations often over-focus on head terms and known competitors. Significant value often sits in the gaps.
Look for:
- Underserved problem statements that no competitor answers well
- Weak landing page matches where ranking pages don't satisfy intent
- Audience splits where the same topic performs differently by user type
- Emerging AI citation gaps where nobody has yet established authority
Competitive analytics is strongest when it helps you find whitespace, not when it only confirms what you already suspected.
Optimize performance
Effective web analytics transforms data into action. If a competitor wins traffic but loses users quickly, you may not need to copy them. If they hold strong positions on terms with weak engagement, a better page can beat them. If they rank well organically but never appear in AI-generated answers, that tells you something about how machines interpret trust and usefulness.
Competitive web analytics works when it changes what your team builds, updates, and measures next.
What it is not
It isn't espionage. It isn't exact traffic counting for other sites. It isn't a replacement for first-party analytics.
It is a decision framework. You use estimates for market context, direct analytics for your own reality, and search visibility data to judge where opportunity is opening or closing.
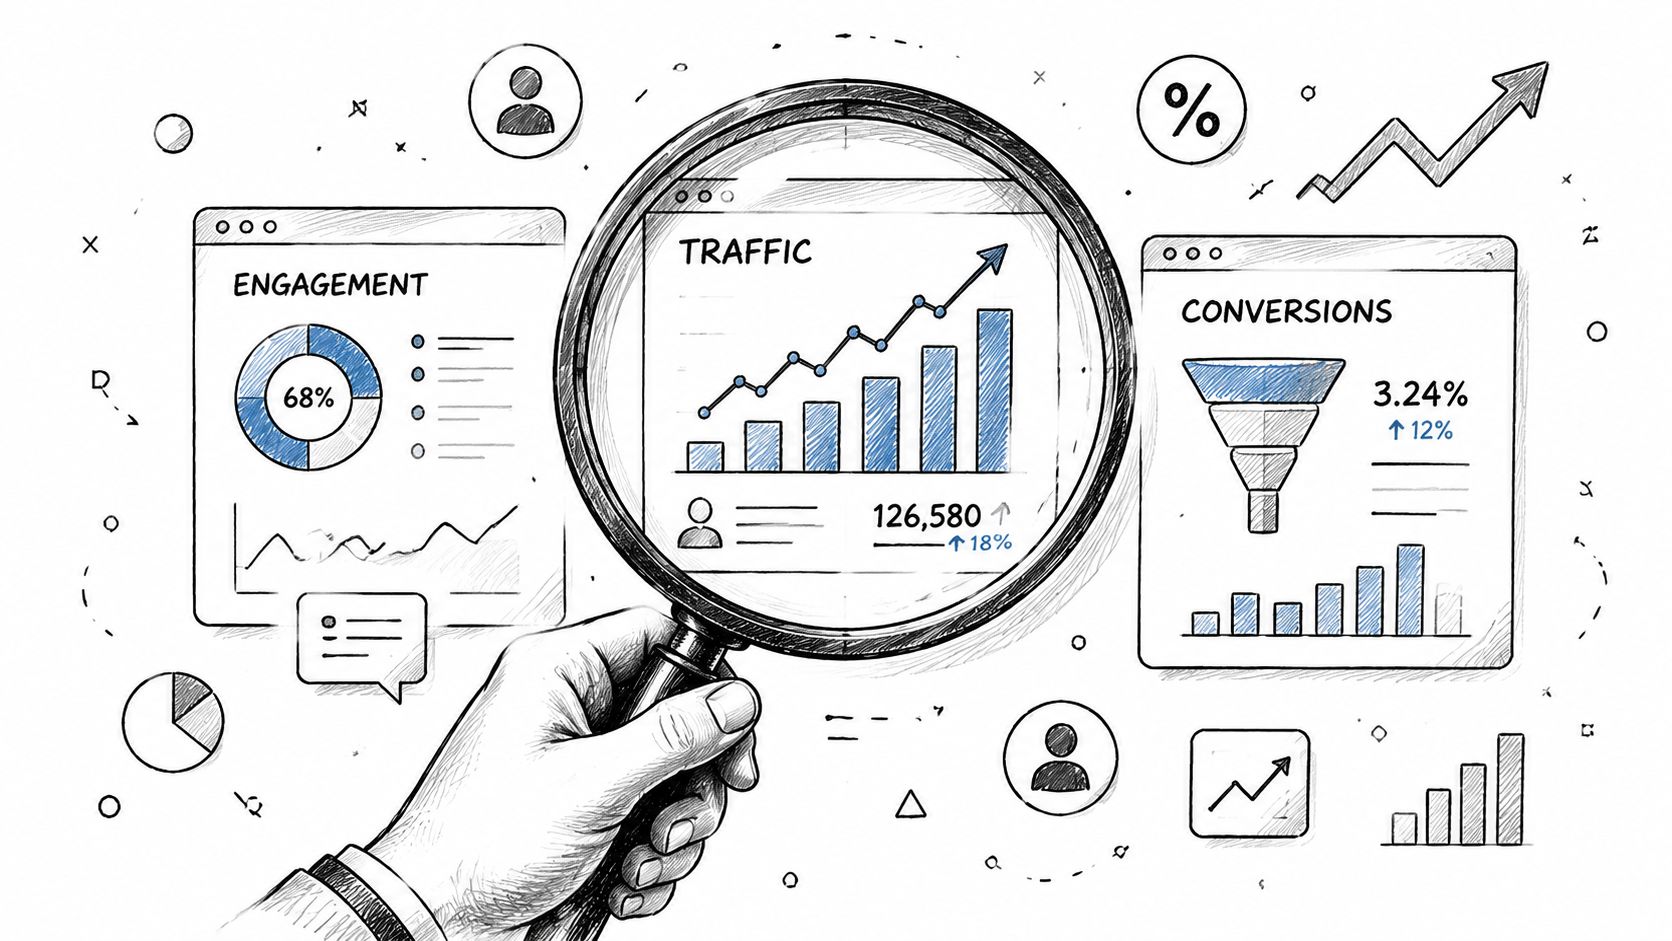
Key Metrics for Benchmarking Competitors
The fastest way to make compete web analytics useful is to stop collecting random metrics. Organize them into a shortlist that supports decisions. Teams typically require three lenses: acquisition, engagement, and visibility.
Acquisition metrics that show demand capture
Start with traffic estimates carefully. No third-party tool can give you a competitor's exact sessions unless you have access to their first-party analytics. What you want is directional context.
Track:
- Estimated traffic trend rather than obsessing over exact counts
- Channel mix such as organic, paid, referral, and direct patterns
- Top organic keywords that appear to drive discovery
- Branded versus non-branded visibility
- Landing page footprint by topic cluster
When I audit a market, I care less about whether a competitor has a perfectly estimated visit count and more about whether multiple data sources agree on the shape of their acquisition strategy.
Engagement metrics that suggest content quality
Industry guidance now commonly recommends tracking metrics such as unique visitors, returning versus new visitors, session duration, pages per session, conversion rate, and Core Web Vitals, according to Factors.ai's guide to key website analytics metrics. The same guide notes benchmark ranges often used in practice, including 2 to 3 minutes average session time and 2.5 to 3.5 pages per session for B2B SaaS. Those aren't universal targets, but they are useful reference points when you're judging whether a site appears sticky or thin.
For competitors, these figures are usually inferred, not confirmed. Treat them as clues.
A practical checklist:
- Session depth: Are users likely exploring beyond a single page?
- Return behavior: Does the brand appear to earn repeat visits?
- Page quality signals: Do top pages load well and feel technically solid?
- Conversion architecture: Are CTAs obvious, specific, and aligned to intent?
For your own site, compare observed behavior in your analytics against the category pattern you see outside. If your pages attract users but lose them quickly, the issue may be the offer, the page match, or the technical experience.
Visibility metrics that tie rankings to clicks
Rankings matter, but rankings without click context can mislead. Factors.ai also cites Search Console CTR benchmarks of roughly 28 to 39% for position 1, 10 to 13% for position 3, and 3 to 5% for position 6 in its overview of normalized web analytics metrics. That helps explain why small rank changes can produce very different traffic outcomes.
Use that logic in competitor analysis:
| Metric | Why it matters | How to use it |
|---|---|---|
| Estimated rank position | Shows where a page sits in the SERP | Prioritize terms where small gains could change click capture |
| SERP feature presence | Reveals who owns enriched search real estate | Watch pages appearing in snippets, packs, and AI elements |
| CTR potential by rank | Connects ranking to traffic reality | Avoid overvaluing terms sitting too low to earn meaningful clicks |
| Share of topic coverage | Measures content breadth | Find clusters where one competitor dominates multiple related queries |
For domain-level competitive context, a tool like Surnex's domain overview can help combine keyword, traffic, backlink, top page, and competing domain views in one place. That's useful when you're moving from isolated keyword checks to an actual market map.
A newer layer is missing from many teams' scorecards. If you're building for AI discovery, add citation frequency, mention rate, and answer presence. For people building that layer, this overview of metrics for LLM visibility strategists is useful because it pushes the measurement conversation beyond classic rank tracking.
Understanding Your Data Sources and Their Limits
Competitive analytics breaks when teams treat every number as equally trustworthy. It isn't. Some data is direct. Some is modeled. Some is inferred from panel behavior. Some comes from crawlers that understand search footprints better than user behavior.
The right habit is simple: match the question to the source.
First-party data
Your own analytics stack is the most reliable source for your own site. It can tell you what happened on your pages, which channels brought sessions, where users converted, and where technical friction showed up.
Its limitation is obvious. It has no native view into competitors.
That's why teams often overestimate their position. Internal analytics can confirm progress without revealing market share loss.
Panel-based data
Historic Compete-style analytics solved that problem with panel measurement. Compete's differentiation came from a panel-based model instead of tag-based instrumentation. Its panel was described as "the largest in the industry," and the platform inferred traffic, engagement, demographics, keywords, and referral sources across millions of sites, as summarized in DiscoverCloud's overview of Compete.
That model is still important conceptually because it explains how many competitive traffic tools work at a high level. They don't need access to the target site. They observe sampled user behavior and estimate broader patterns.
Panel data is strong for comparison across sites. It is weaker for exact conversion analysis on a single site.
Crawler and SERP data
SEO tools work differently. They crawl pages, collect keyword rankings, map backlinks, and estimate traffic from search footprints. They are excellent for understanding discoverability. They are not direct traffic meters.
Many reporting arguments commonly begin with scenarios like this. One tool says a competitor is growing. Another suggests decline. Often both are reacting to different parts of reality. A crawler may detect improved keyword coverage while panel data suggests weak actual user engagement.
Comparison of competitive data sources
| Data Source Type | How It Works | Best For | Limitation |
|---|---|---|---|
| First-party analytics | Tracks behavior on a site you control | Conversion analysis, real user behavior, technical diagnosis | Can't see competitors |
| Panel-based data | Infers traffic and engagement from sampled user panels | Cross-site comparison, market benchmarking, estimated audience patterns | Less exact than direct instrumentation |
| Crawler and SERP data | Collects pages, rankings, backlinks, and search footprints | SEO analysis, keyword gaps, content competition, visibility mapping | Traffic is estimated, not observed directly |
How to use them together
A strong competitive intelligence function doesn't pick one source and defend it forever. It triangulates.
Use first-party analytics to understand your actual performance. Use panel-style data for directional market comparison. Use crawler data to explain where visibility is being won or lost. When several sources point in the same direction, confidence goes up. When they disagree, that's not failure. That's a signal to investigate.
Benchmarking Visibility in AI Search
Traditional compete web analytics still matters, but it no longer covers the whole field. Buyers increasingly discover brands inside AI-generated answers, summary layers, and conversational tools. If your competitive reporting stops at rankings and backlinks, it is already incomplete.
A major gap in current guidance is exactly this question: how do you compare competitors across AI search surfaces instead of only classic web traffic? The problem is increasingly visible because most competitor analysis content still centers on SEO, backlinks, and traffic estimation, while discovery now also happens inside Google AI Overviews and conversational assistants, as discussed in Right Angle Global's piece on competitor profiling and analysis.
What to measure now
Classic organic rank is still a useful signal. It just isn't enough on its own.
Add these dimensions:
- Answer presence. Does the brand appear in AI-generated responses for core topics?
- Citation frequency. How often is the domain referenced or linked when AI systems answer category questions?
- Competitor mention share. Which brands are named most often in comparative prompts?
- Prompt coverage. Across commercial, informational, and evaluative prompts, where does your brand appear or disappear?
- Source alignment. Which pages or content types seem to earn citations?
A platform focused on AI visibility monitoring can help track that layer alongside traditional SEO data, which matters because citation gaps often stay invisible if you're only watching standard rankings.
Why old methods fail here
Old-school competitive reports assume the path is simple. Query, SERP, click, session, conversion. AI breaks that sequence.
A user can ask a buying question, receive a synthesized answer, see three cited brands, and never perform the classic click pattern your old dashboard expects. That means your competitor may be influencing demand earlier than your reporting model can see.
If AI systems mention your competitors before users visit any website, search visibility has already shifted upstream.
A practical way to benchmark AI search
Start with a prompt set, not a keyword list alone. Include:
- Problem prompts such as how-to or troubleshooting questions
- Comparison prompts where brands are evaluated side by side
- Category prompts that define the vendor shortlist
- Decision prompts focused on pricing, fit, or implementation concerns
Then record what appears. Which brands are mentioned. Which domains get cited. Which page types seem to feed those answers. Over time, patterns emerge. Some brands dominate organic rankings but barely appear in AI summaries. Others appear often because their content is structured, quotable, and trusted.
That is the new frontier of compete web analytics. Not just who ranks, but who gets repeated.
A Tactical Workflow for Competitive Analysis
Competitive analysis often becomes too big, too slow, or too vague. The fix is a repeatable workflow. Small enough to run every month. Sharp enough to guide content, SEO, and reporting decisions.
Start with the process below.
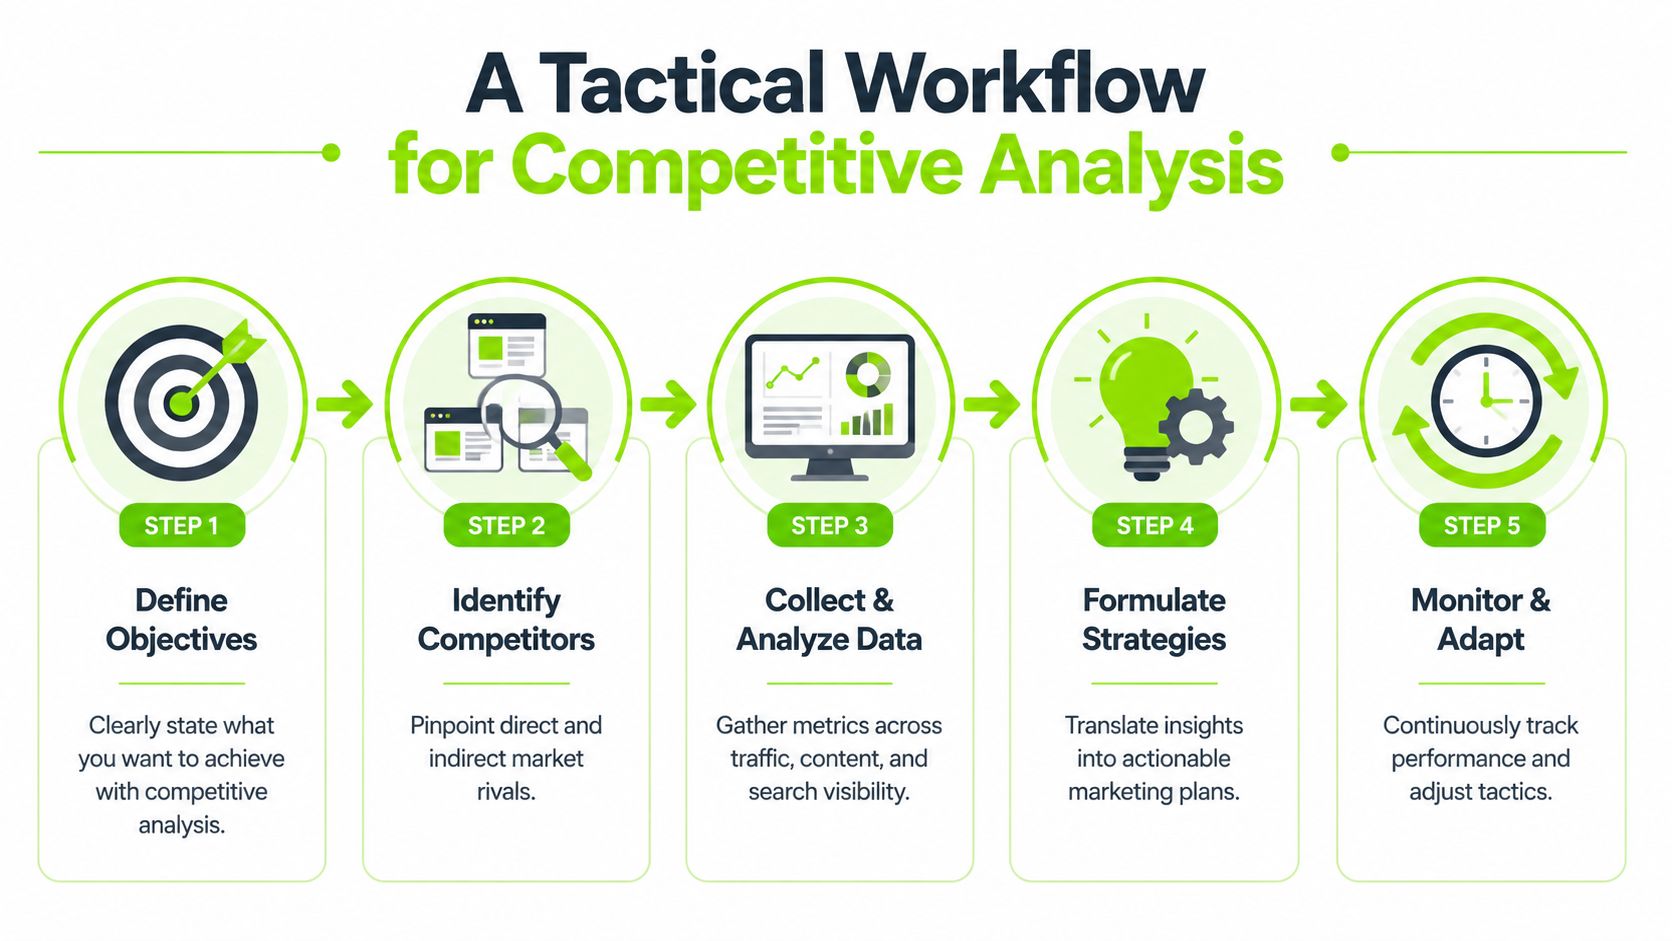
Phase 1 define the real competitors
Your sales team, paid media team, and SEO team often name different competitors. That's normal. You need all three views.
Build a list that includes:
- Direct business competitors that prospects already compare against you
- Search competitors that dominate the same keywords even if they sell differently
- AI-answer competitors that appear in cited or synthesized results
- Publisher and review competitors that intercept demand before vendor pages do
Phase 2 gather mixed-source data
Pull data from first-party analytics, search tools, SERP tracking, and AI visibility checks. Don't chase perfect completeness. Chase enough coverage to spot patterns confidently.
For recurring monitoring, a workflow for rank monitoring and changes helps teams keep movement visible instead of rebuilding reports from scratch each cycle.
A short training video can help teams standardize the process before they automate it:
Phase 3 analyze gaps with commercial intent in mind
At this stage, most reports drift into trivia. Avoid that.
Review the data through four questions:
- Where are competitors winning discovery
- Which topics drive commercial intent rather than just traffic
- Where does your content under-serve the query
- Which AI prompts cite competitors but ignore you
That gives you a working list of actions, not a vanity deck.
Agency habit: Every competitive report should end with page decisions, content decisions, and measurement decisions. If it only ends with observations, it isn't finished.
Phase 4 turn insight into assignments
Good analysis dies in slides. Turn findings into owners and deadlines.
Examples:
- Content team updates weak pages and builds missing clusters
- SEO team addresses internal linking, technical issues, and SERP feature opportunities
- CRO team tests CTA and page structure on high-opportunity landing pages
- Strategy lead updates the benchmark set if new AI-answer competitors emerge
Keep the report short. One page for executives, one working sheet for specialists, and one backlog for implementation.
Automating and Integrating Your Reporting
Manual competitor reporting is fine at the start. It doesn't scale well across multiple clients, markets, or prompt sets. The next step is integration.
Pull ranking data, traffic estimates, backlink signals, and AI visibility checks into one reporting layer. Teams often use internal dashboards or BI tools to do this. The important part isn't the front end. It's the logic underneath. Separate direct data from estimates. Label modeled fields clearly. Keep trend lines consistent.
The best automation use case is correlation. If a competitor starts appearing more often in AI answers while your rankings hold steady, your reporting should surface that divergence early. If your keyword positions improve but your brand isn't being cited in synthesized answers, that should trigger a content review, not a celebration.
For delivery, a workflow for client-ready reporting helps agencies package these signals into something stakeholders can use. That's the maturity curve. Competitive analysis stops being an occasional research project and becomes an operating system for search decisions.
Surnex helps agencies, in-house teams, and technical teams monitor traditional SEO and emerging AI search visibility in one place. If you need a clearer view of how brands appear across rankings, backlinks, AI Overviews, and LLM-driven discovery, explore Surnex.